Native trace and monitor
When a game offers no engine metadata – or the logic you look for is plain C++ – the native tools work on machine code directly, for any engine.
Native trace
View → Native trace … answers which functions run when I do this? It uses Frida's Stalker to count the functions the chosen threads call:
- Choose the threads and modules to follow. Preselected are the threads active right now and the modules in the game's folder.
- Start following: Stalker recompiles the code of these threads and counts every function call. System libraries run unchanged; only calls into them are counted.
- Record a baseline while the game idles.
- Record a scenario while doing the thing you are interested in, e.g. paying gold.
- The functions that are new in the scenario, or called more often there, are the candidates.
The game runs noticeably slower while it is followed. The native trace can be docked at the bottom of the main window.
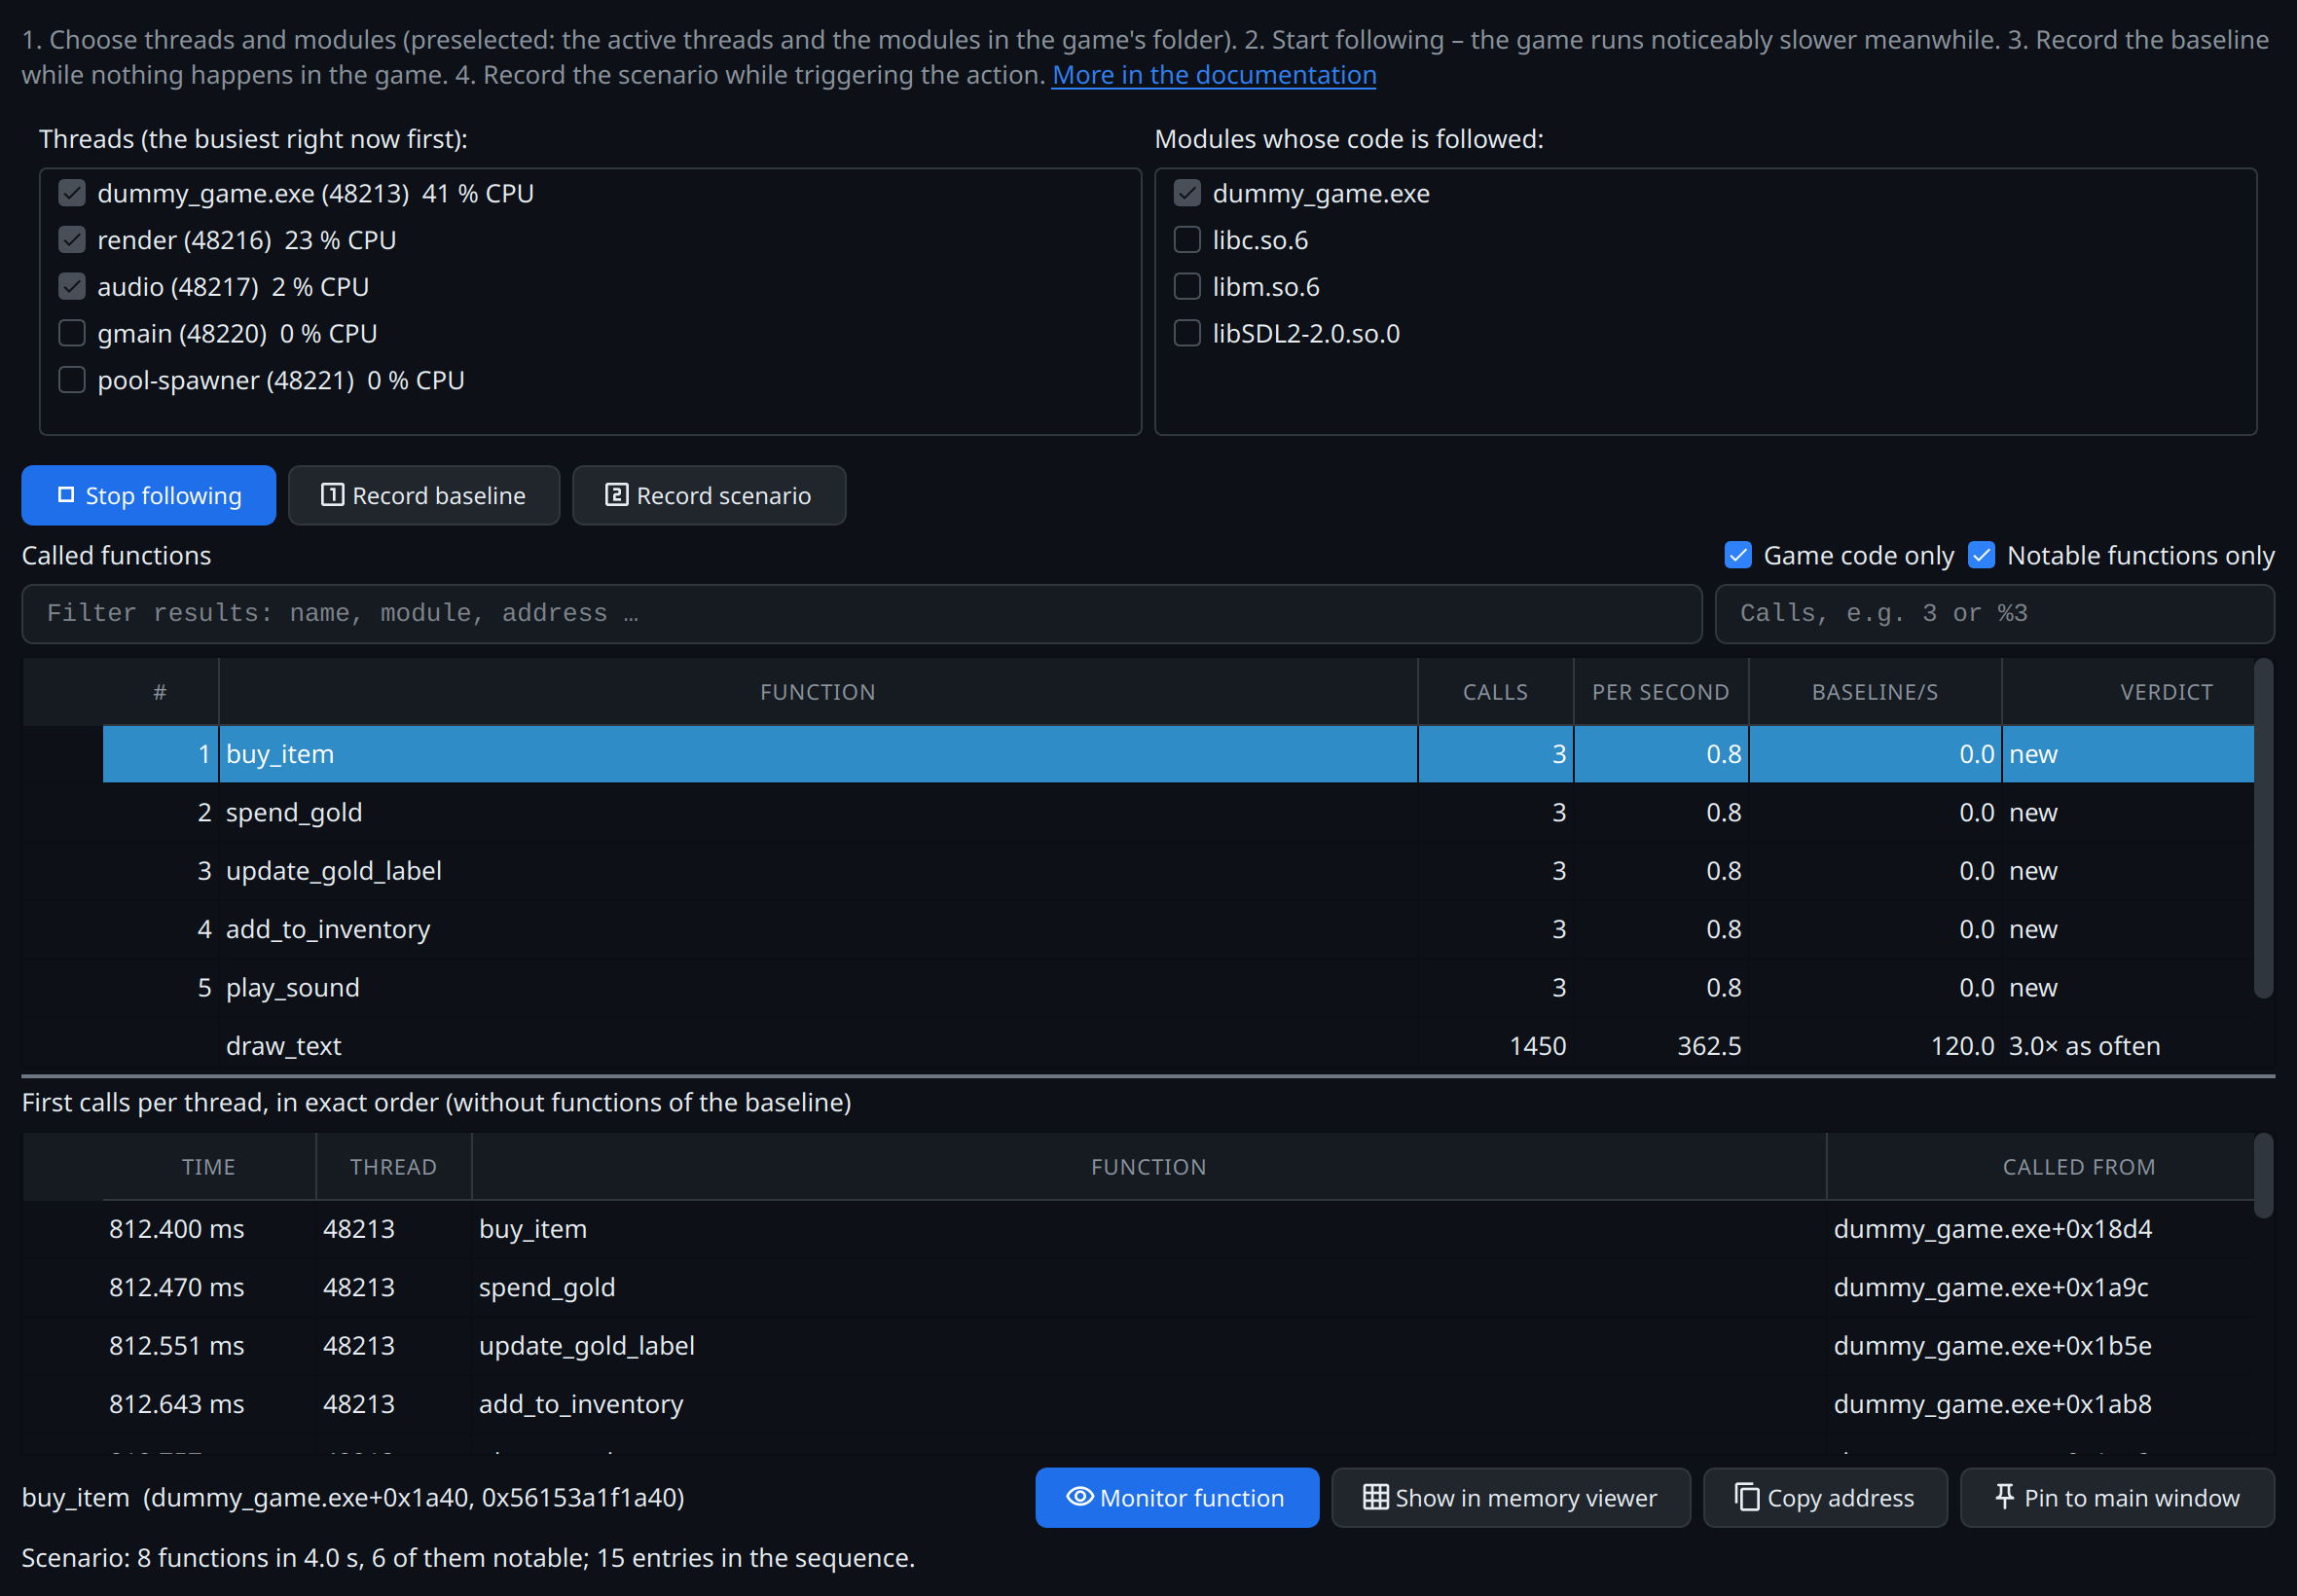
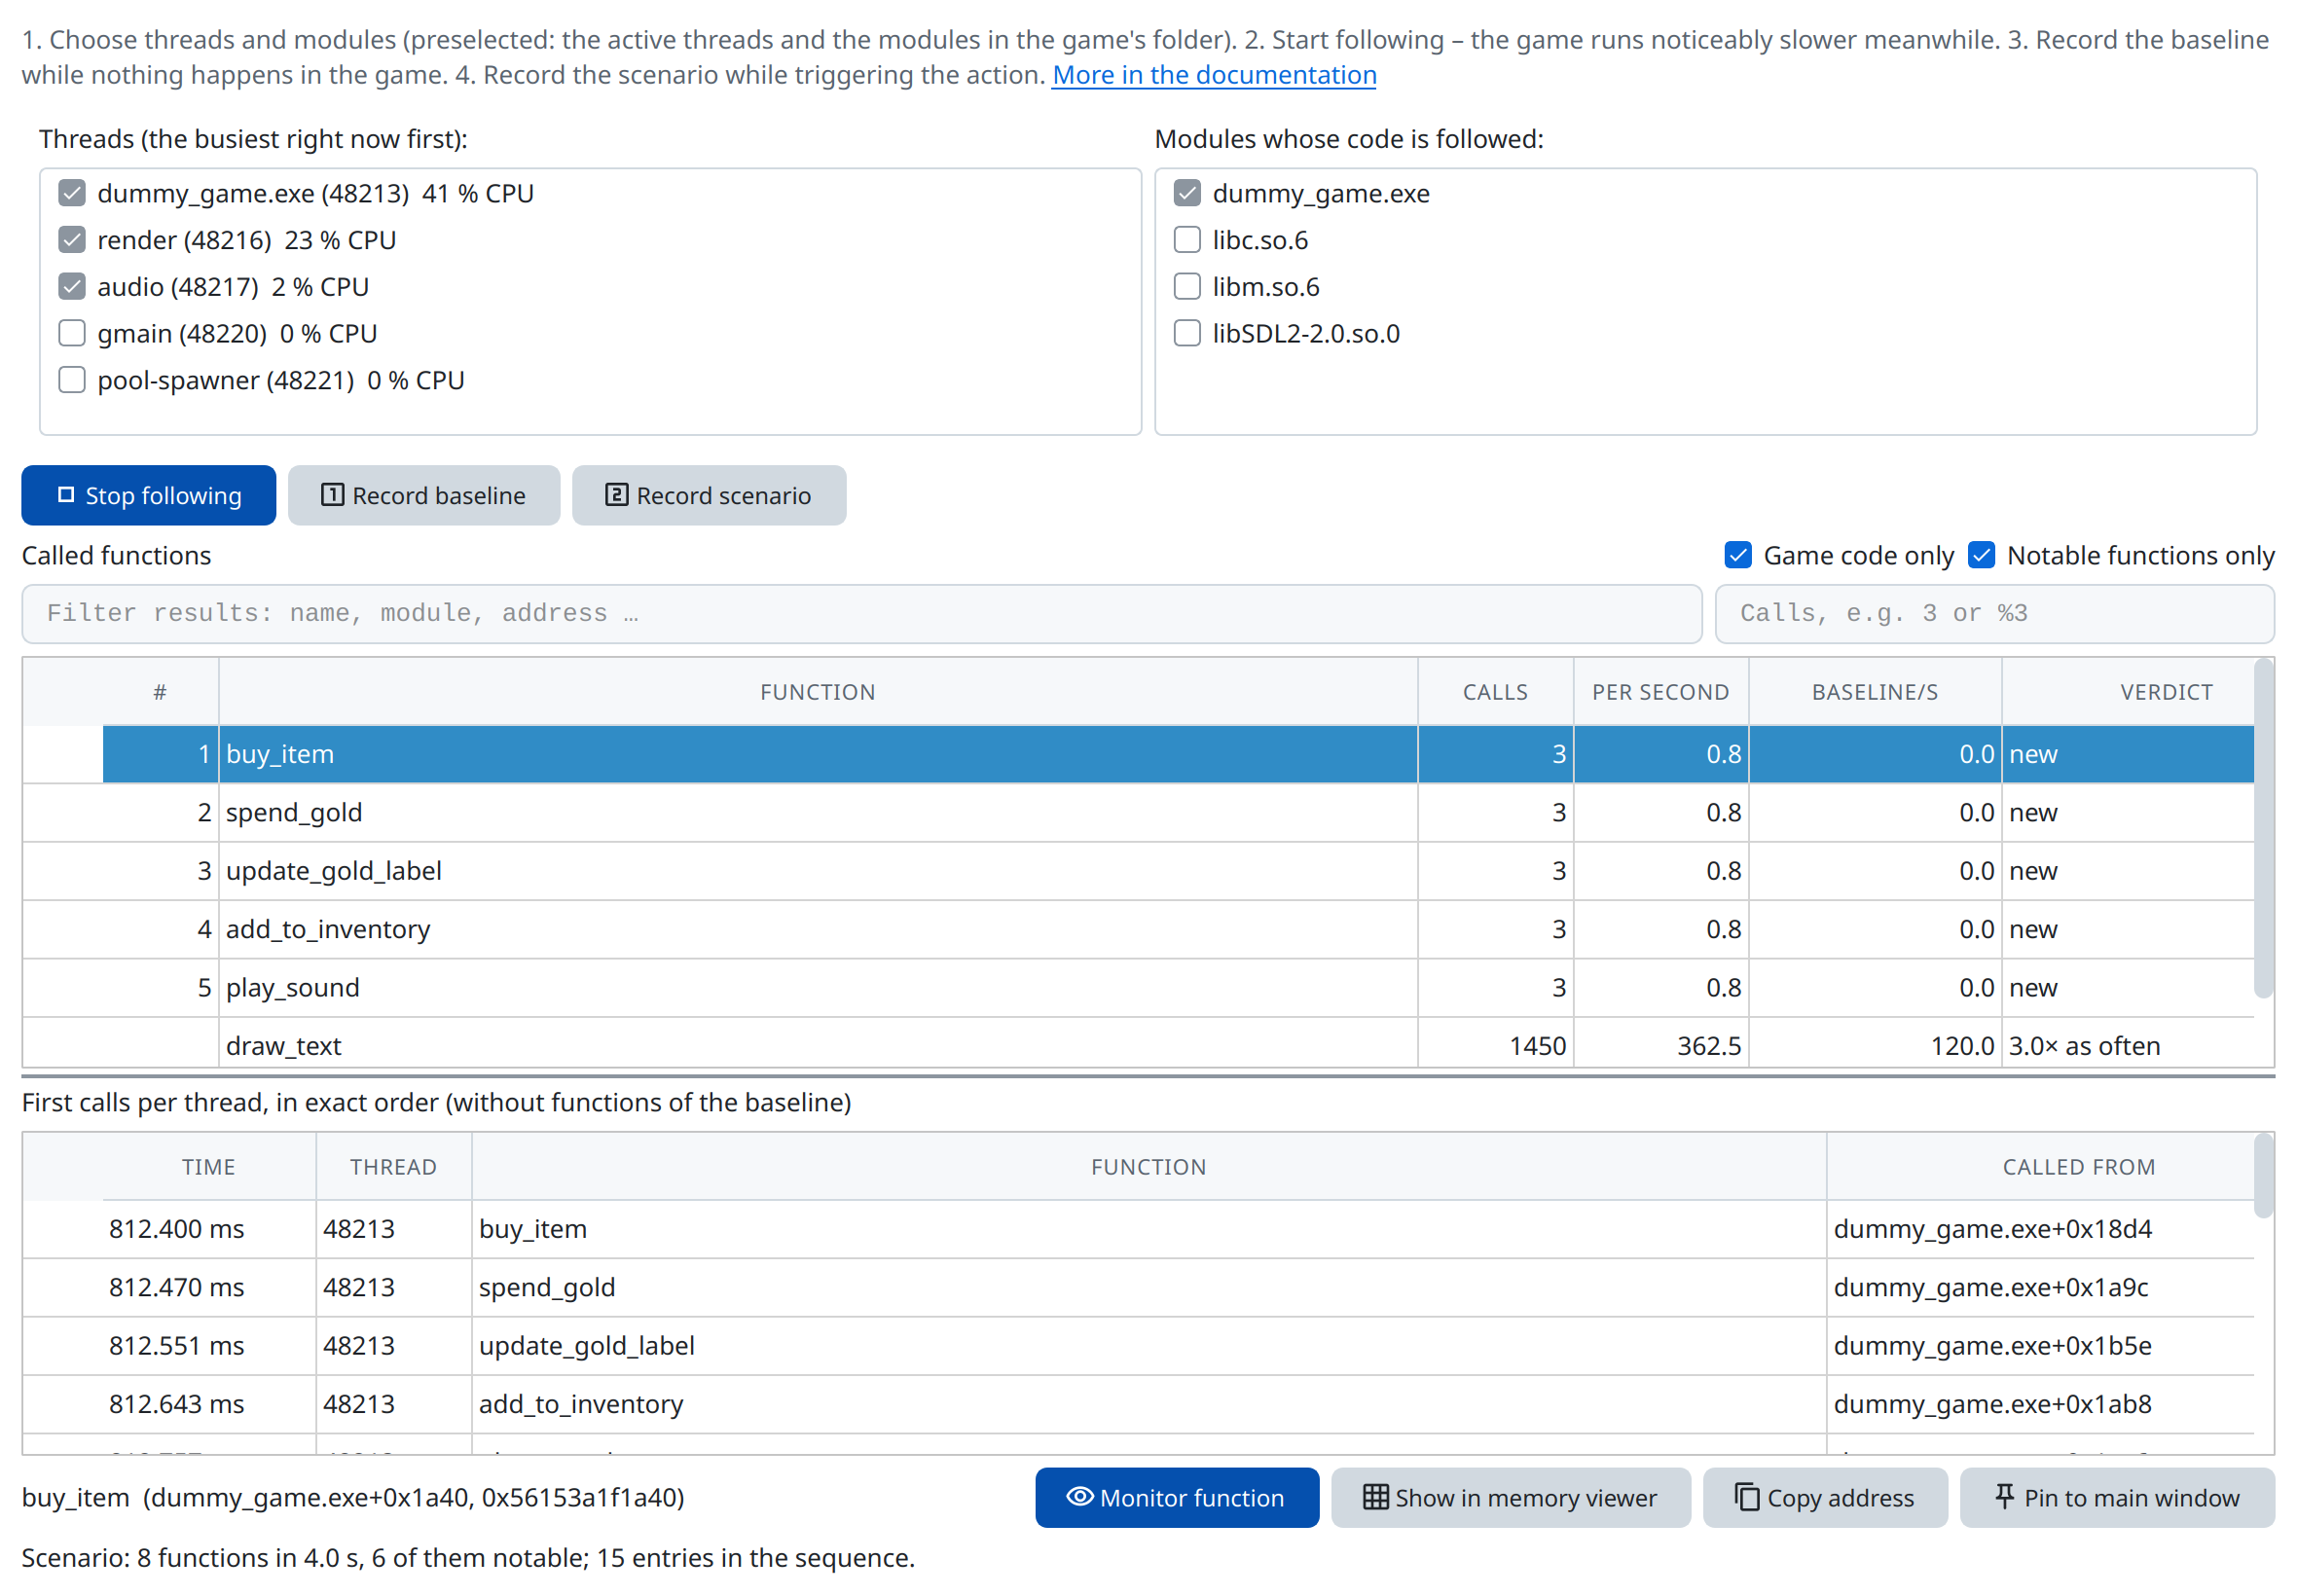
Candidates can be marked with ★ as favorites or handed to the monitor. A function found this way can be called from a script through ctx.native. The code explorer shows what it does and who calls it.
Warning
Stalker rewrites the code of the traced threads while it runs. Grembyte asks before it starts, since this can slow down or, rarely, crash a game.
Native function monitor
Monitor native function … logs the calls of one function: its arguments, the result and the caller. For pointer arguments it compares the memory behind them before and after the call, so you see what the function changed. The monitor can be docked at the bottom of the main window.
| Arguments | Floating-point arguments | Result | |
|---|---|---|---|
| Linux, x86-64 | rdi, rsi, rdx, rcx, r8, r9 |
xmm0–xmm7 |
rax, or xmm0 |
| Windows and Wine/Proton, x86-64 | rcx, rdx, r8, r9, then the stack |
xmm0–xmm3 |
rax, or xmm0 |
| 32-bit programs | the stack | the stack | eax |
On x86-64 the first argument of a C++ method is this, the object it runs on. The xmm registers appear in a call's details with both readings, as float and as double: which one is meant, the signature tells (below). Writes to memory that no argument points to are not visible.
For a function in a module whose file Grembyte can read (x86-64), the column Signature (guessed) shows which arguments the function's code reads and what callers do with its result, as the code explorer guesses them: void (int rdi) for a function taking one int and returning nothing. With Guessed signature ticked, the log shows only those arguments, typed (int rdi=23, float xmm0=1.5), a float or double result read from xmm0, and no result for a void function; unticked, it shows the raw argument registers and rax. The example with the test game explains how the guess is made and how to check it.
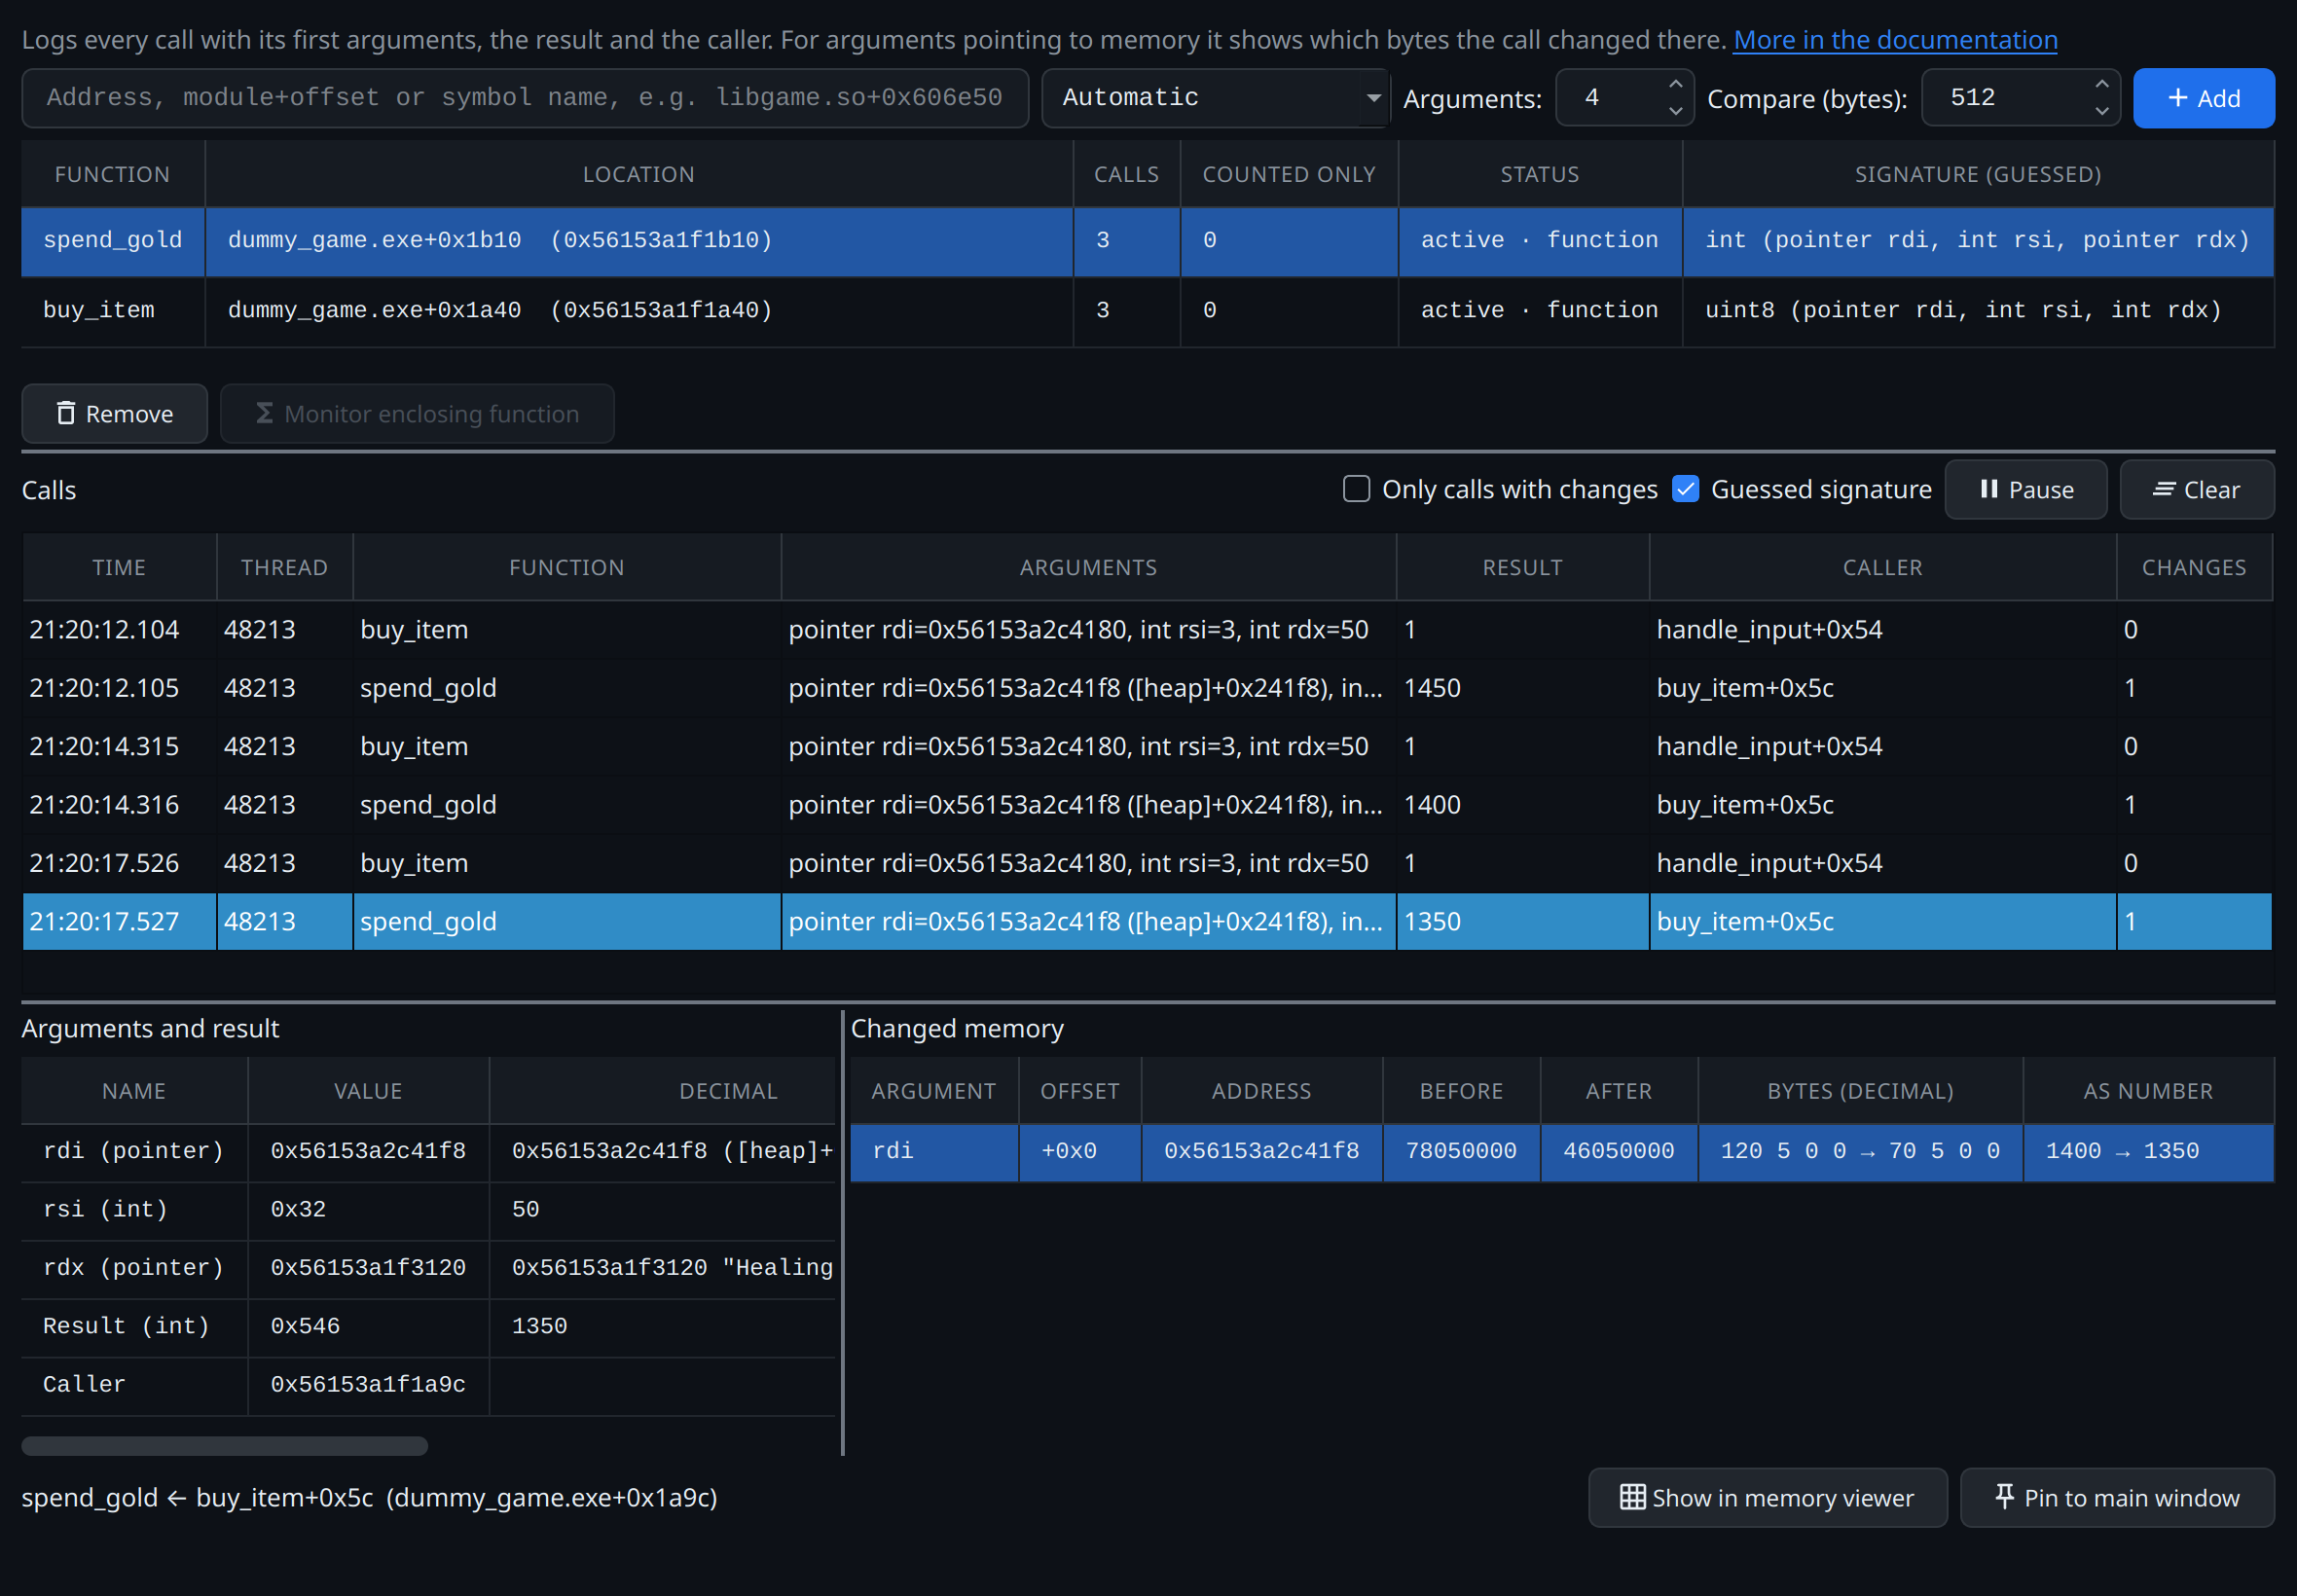
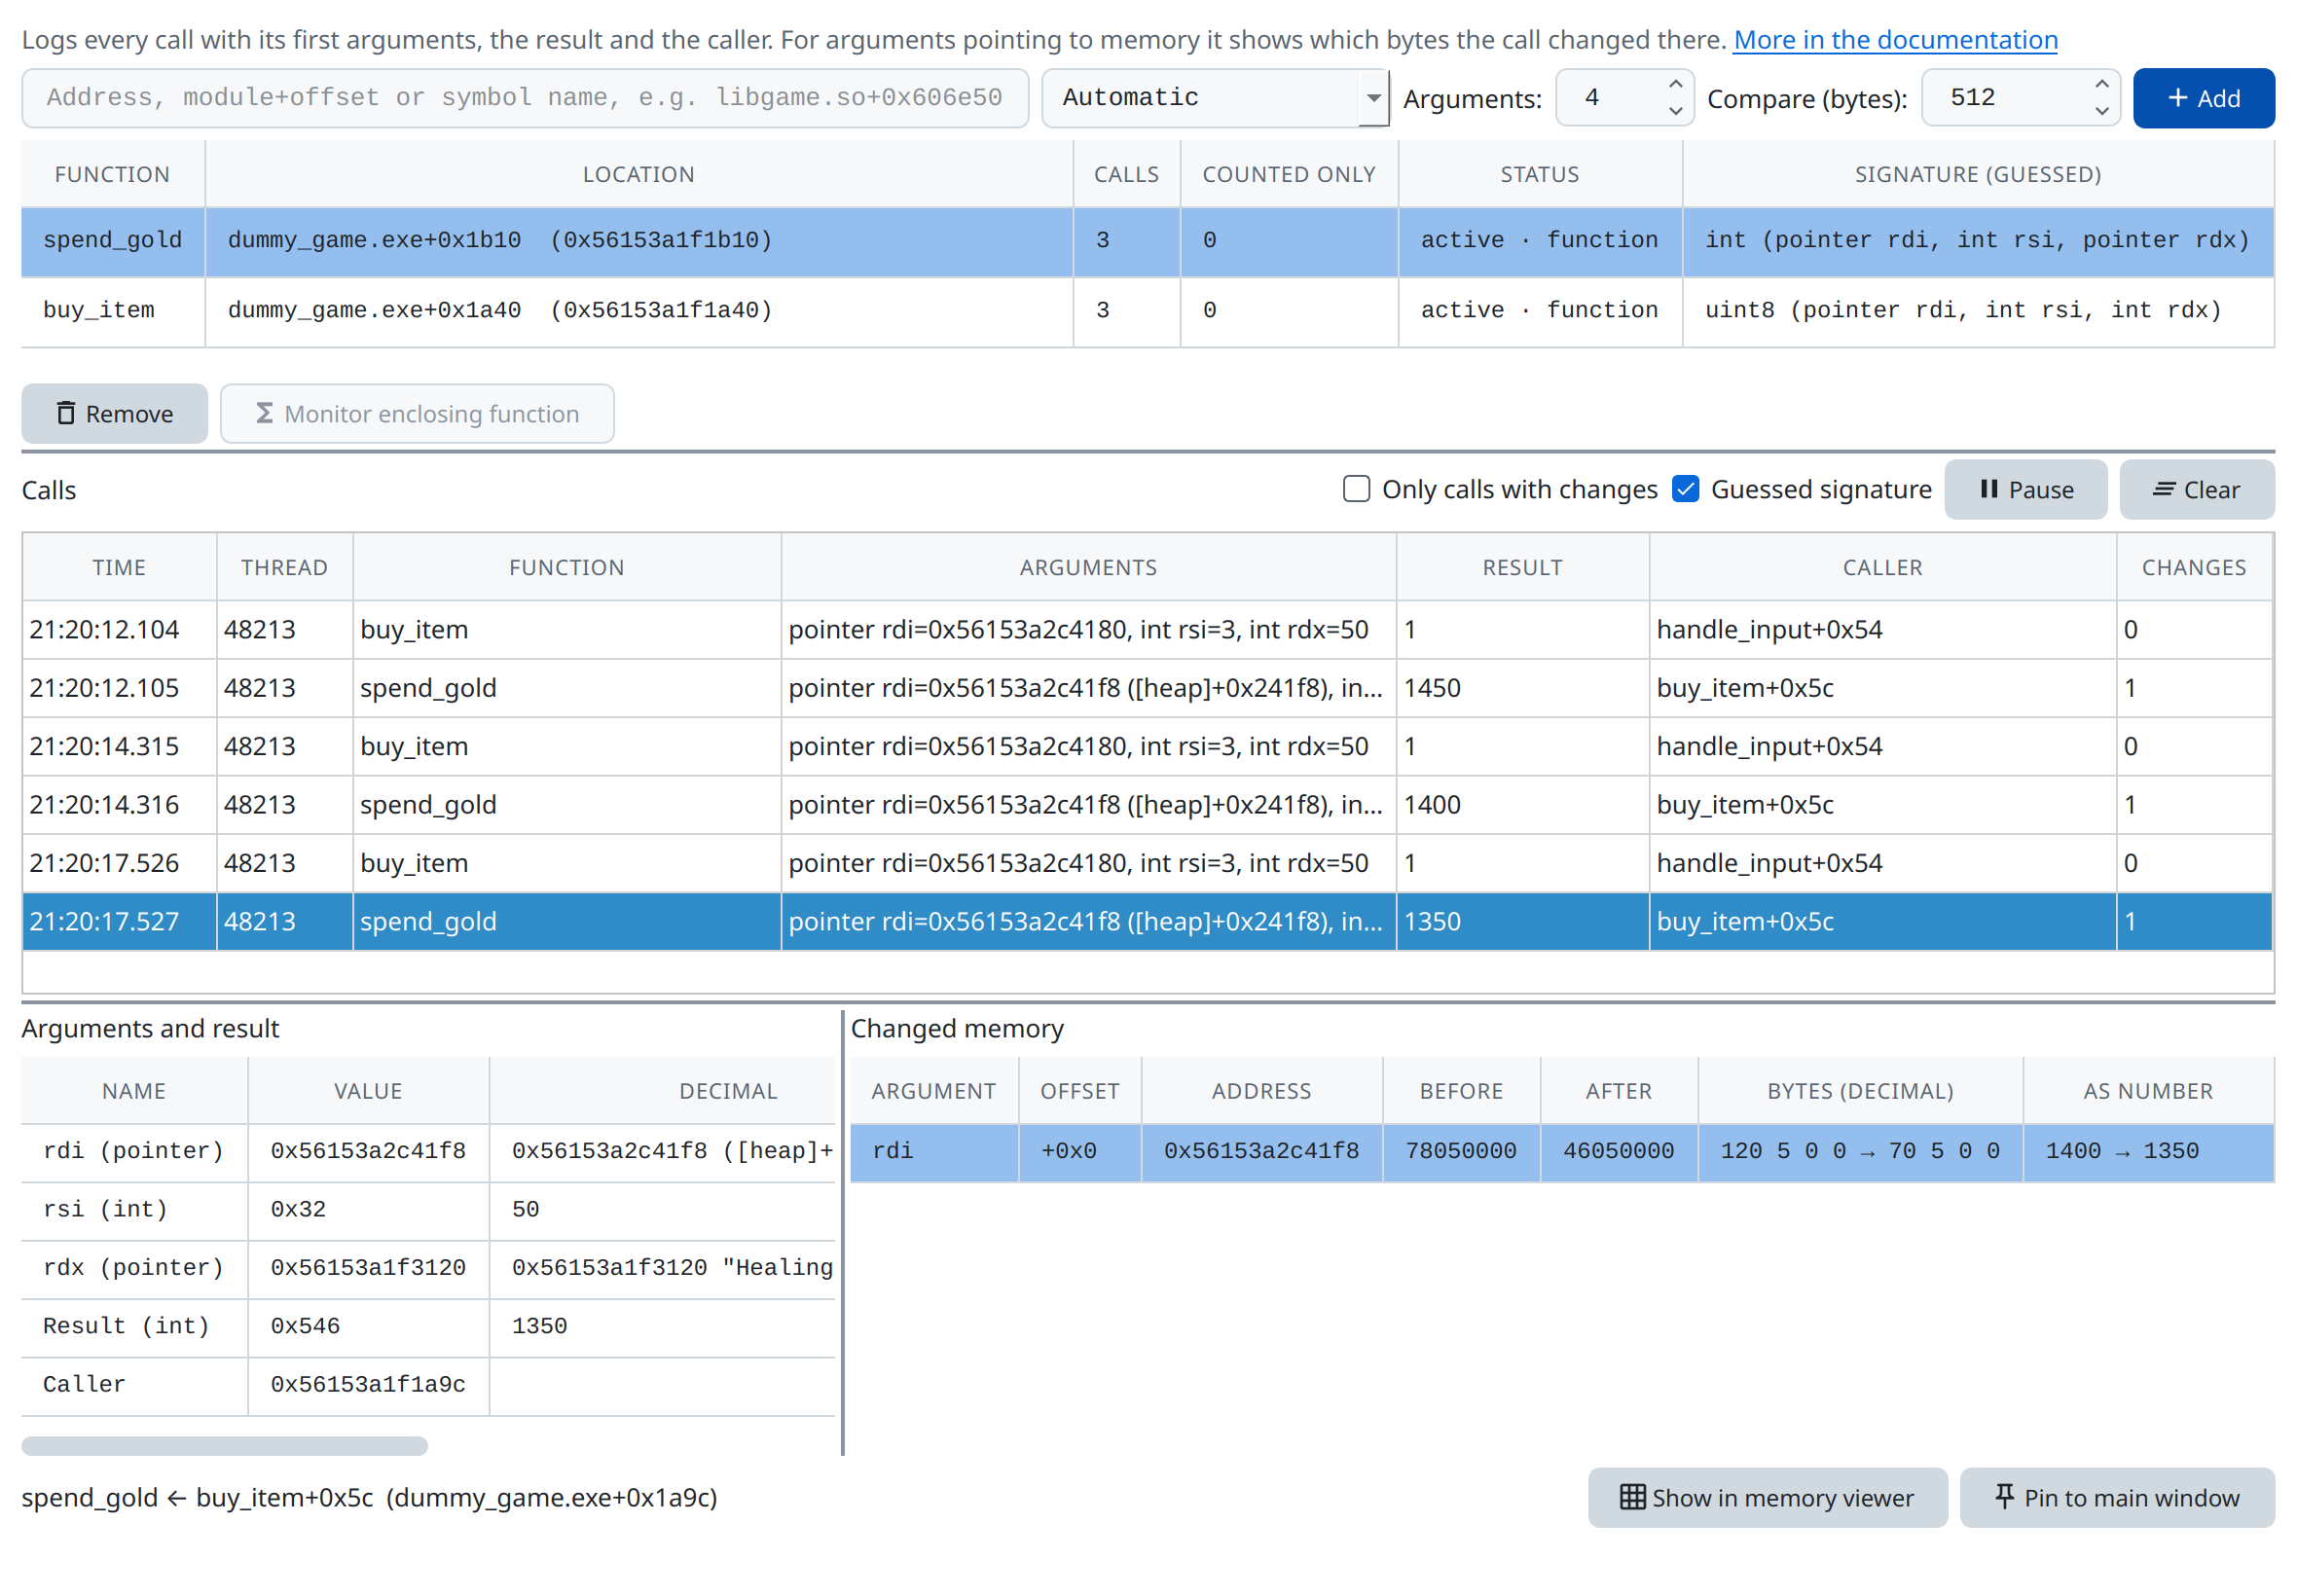
Open it from a candidate of the native trace, from a favorite, or with an address you type in.