Docking, memory, sessions and logs
Docking windows
Windows of their own cannot be kept beside the main window on every desktop (Wayland does not let programs place their windows). The tools you keep using while the game runs can therefore be docked in the main window instead: Pin to main window in the tool's window docks it as a tab, Detach gives it a window of its own again.
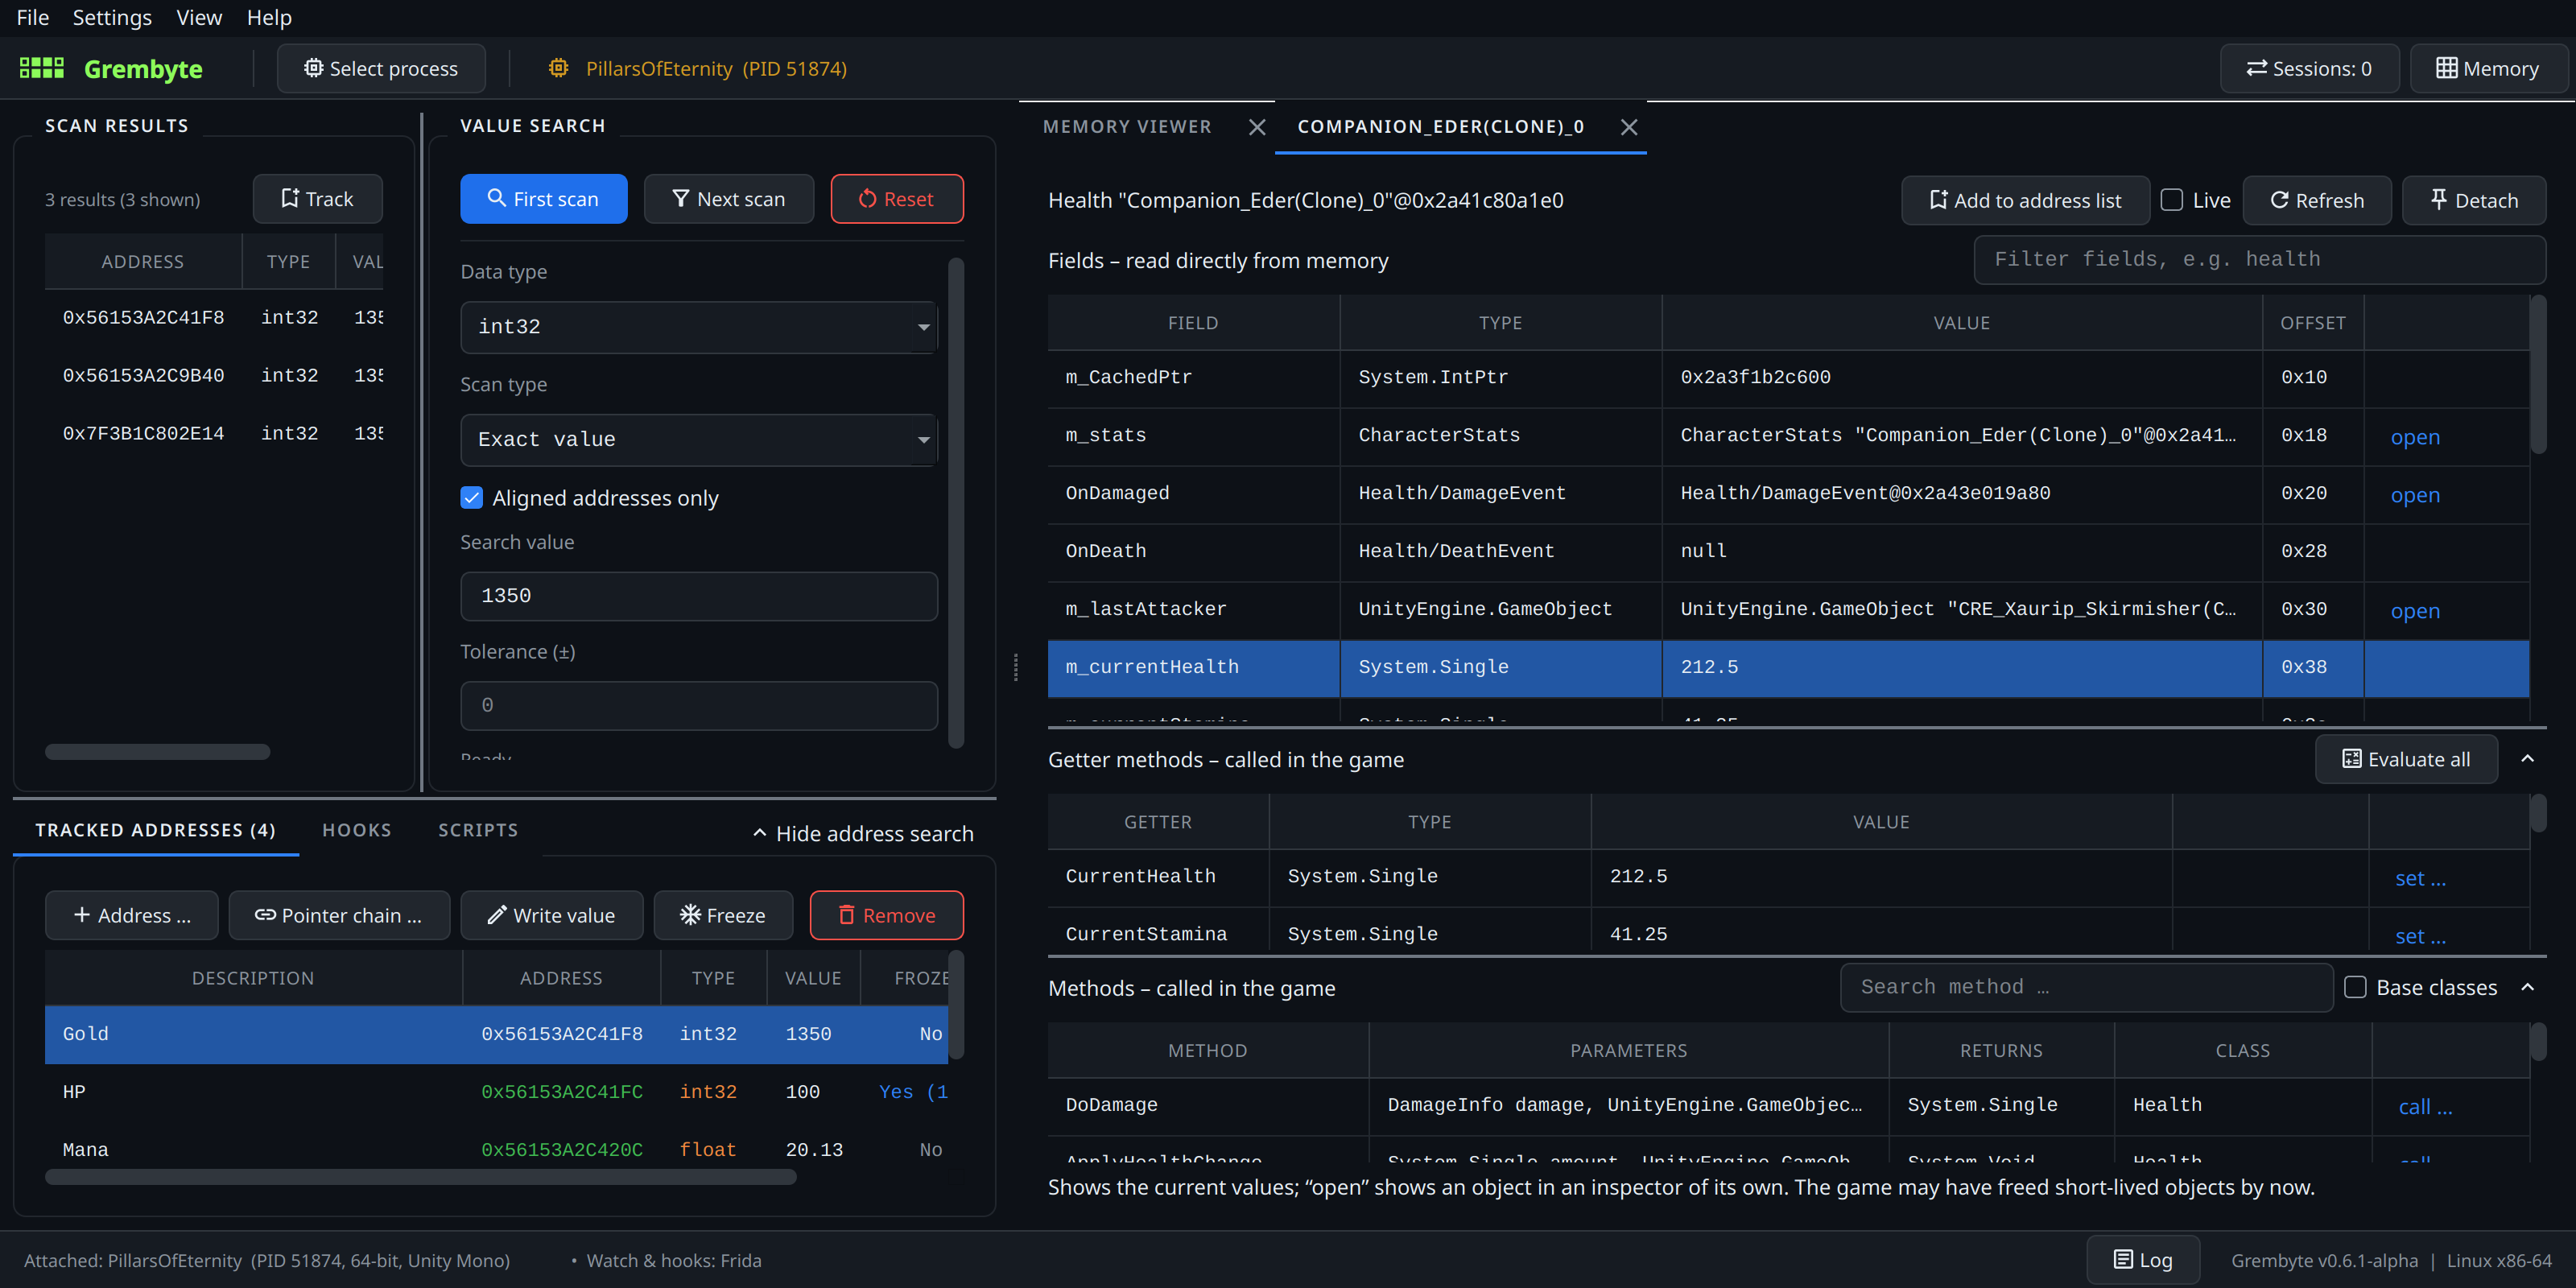
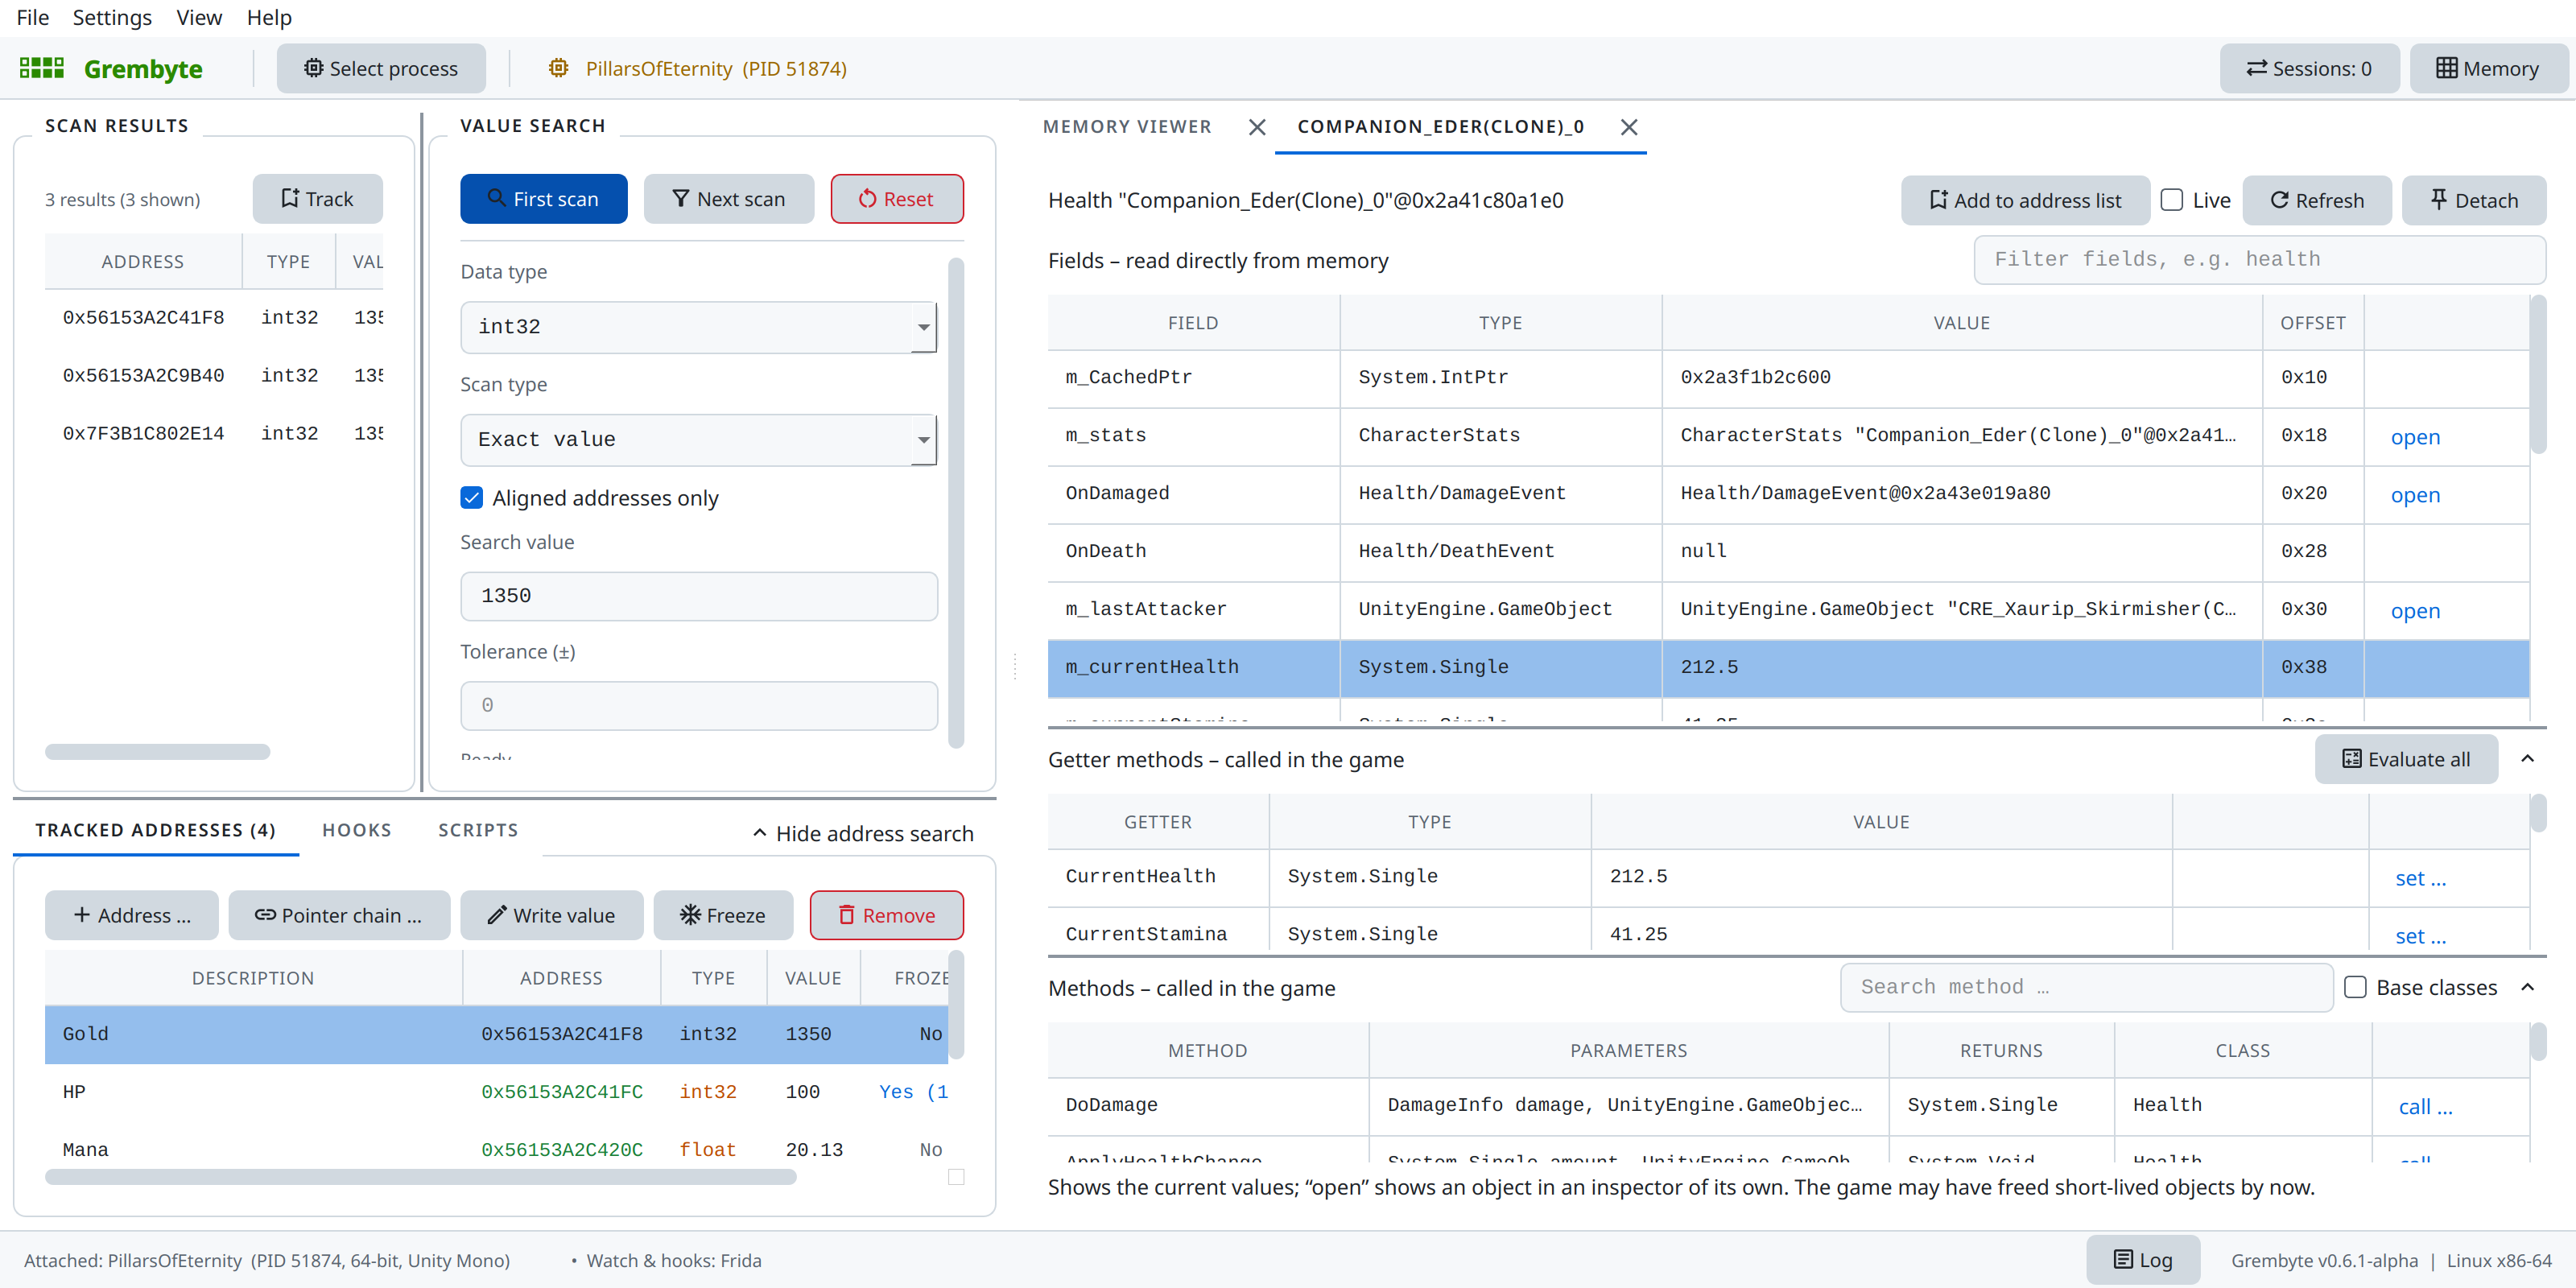
- At the side: pointer scan, object inspector, object browser, write watch, memory viewer, GAS attributes.
- At the bottom, where wide tables have room: trace, native trace, method monitor, native function monitor, log.
- Each side holds its windows as tabs. The ✕ on a tab, or a middle click, closes the window. A docked object inspector shows the object's name in its tab (else its class); the full title is in the tooltip.
- Grembyte remembers per kind of window whether the last one was docked: the next opens the same way. An object opened from a docked inspector opens as a tab beside it.
- When the game ends or another program is chosen, the tools close, docked or not. The log stays, and so does the pointer scan: it is meant to find the value again after a restart.
Memory viewer
Memory in the toolbar, or Show in memory viewer in the context menu of an address, shows the memory around an address as bytes and as text. It can be docked beside the scanner.
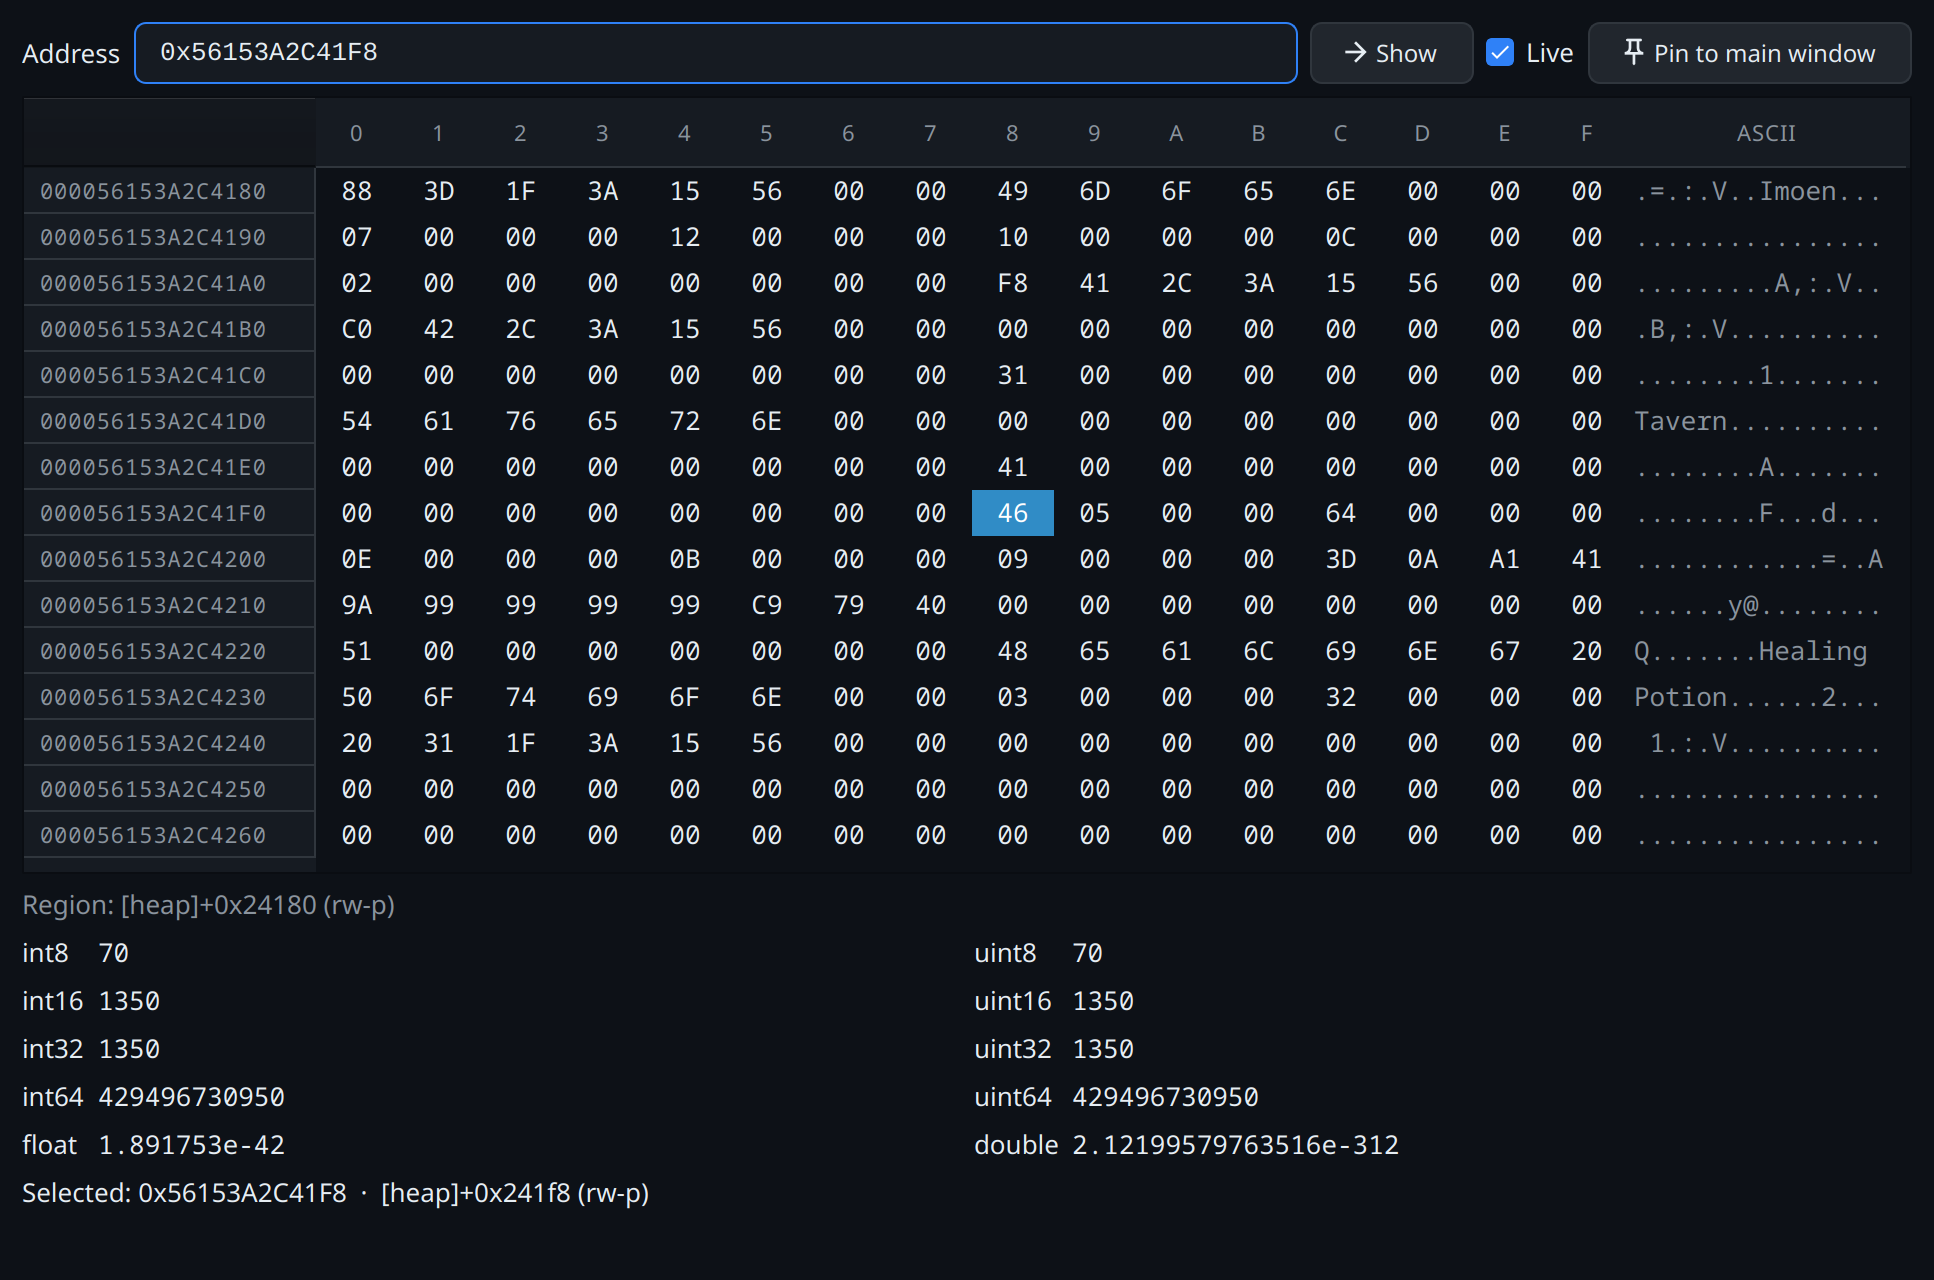
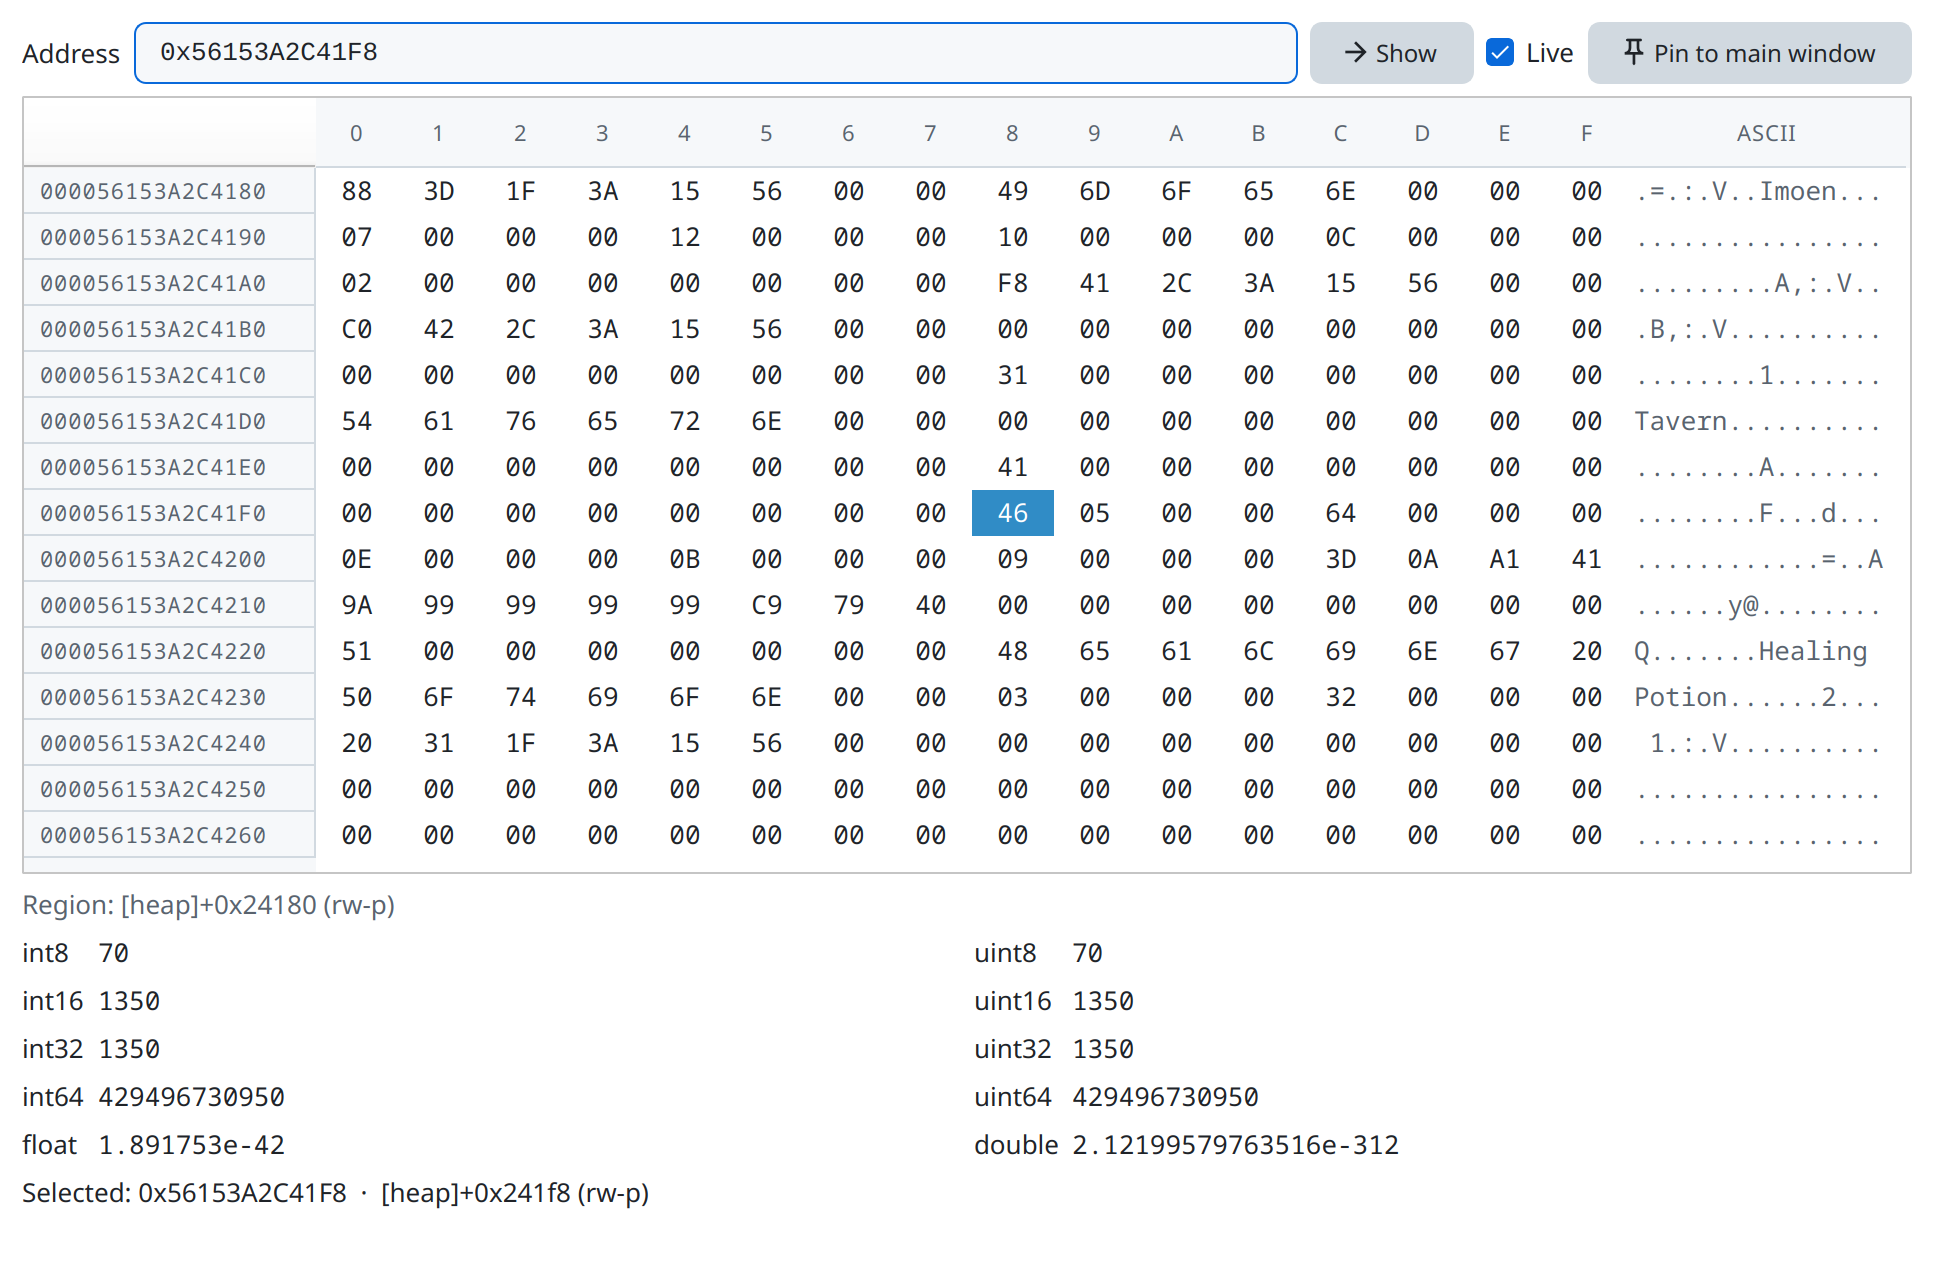
46 05 00 00 in little-endian.Sessions
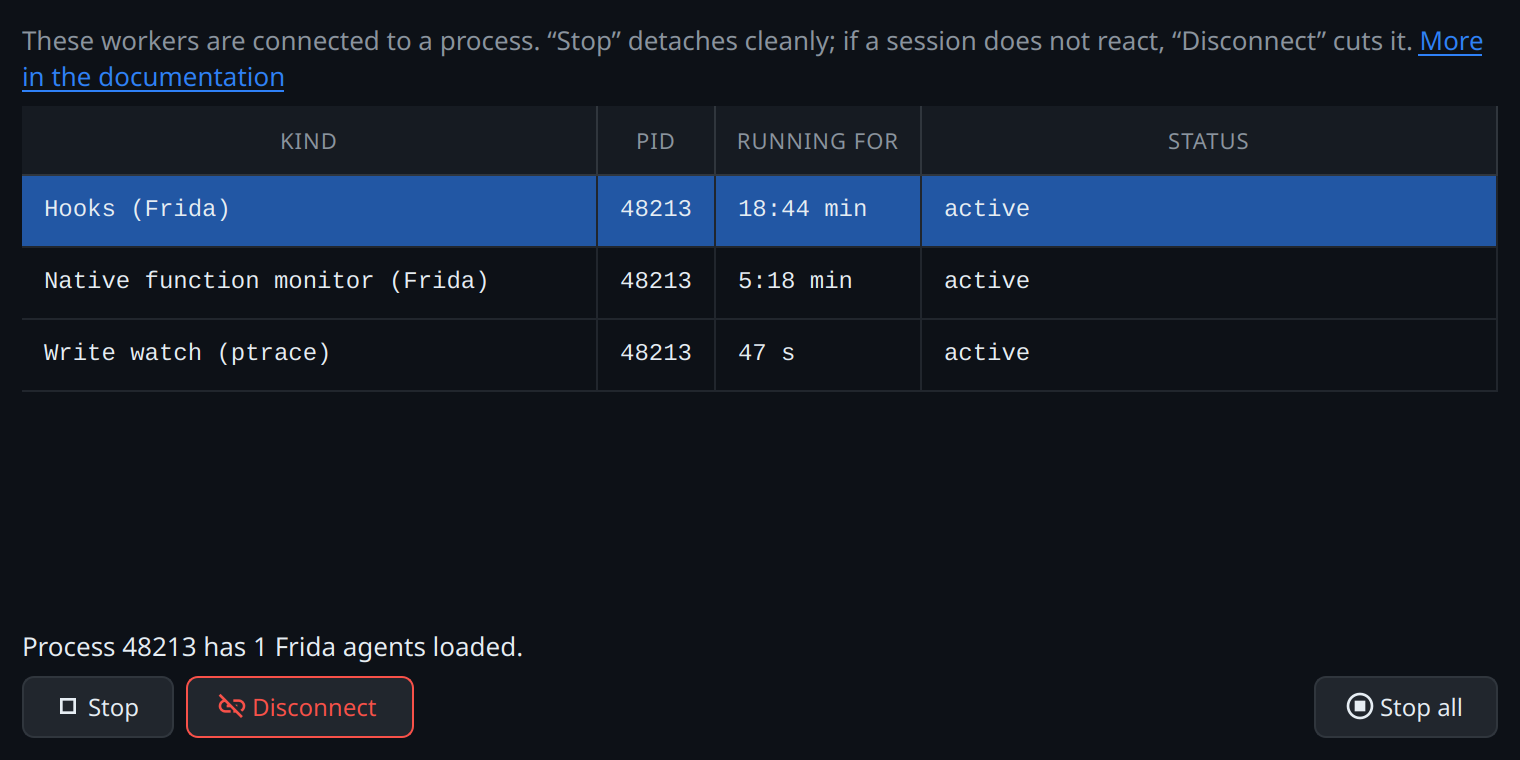
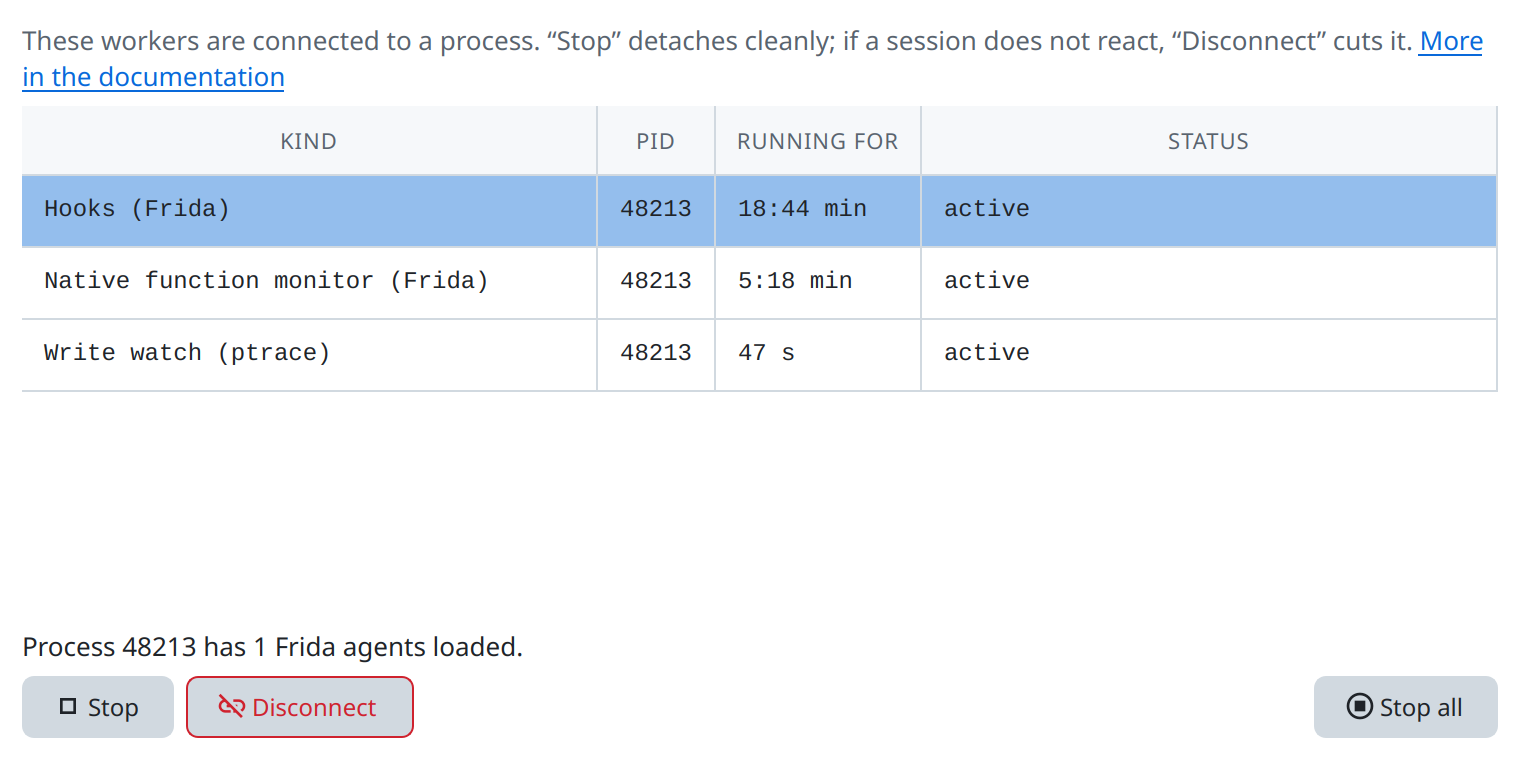
Sessions in the toolbar lists Grembyte's connections to processes – Frida sessions and ptrace attachments – with what uses them. A session that no longer responds can be cut there:
- Stop lets the session remove its hooks and detach cleanly.
- Disconnect cuts the Frida session if it does not react to Stop. The part of Grembyte it belongs to (e.g. the hooks) then has to be started again.
Favorites
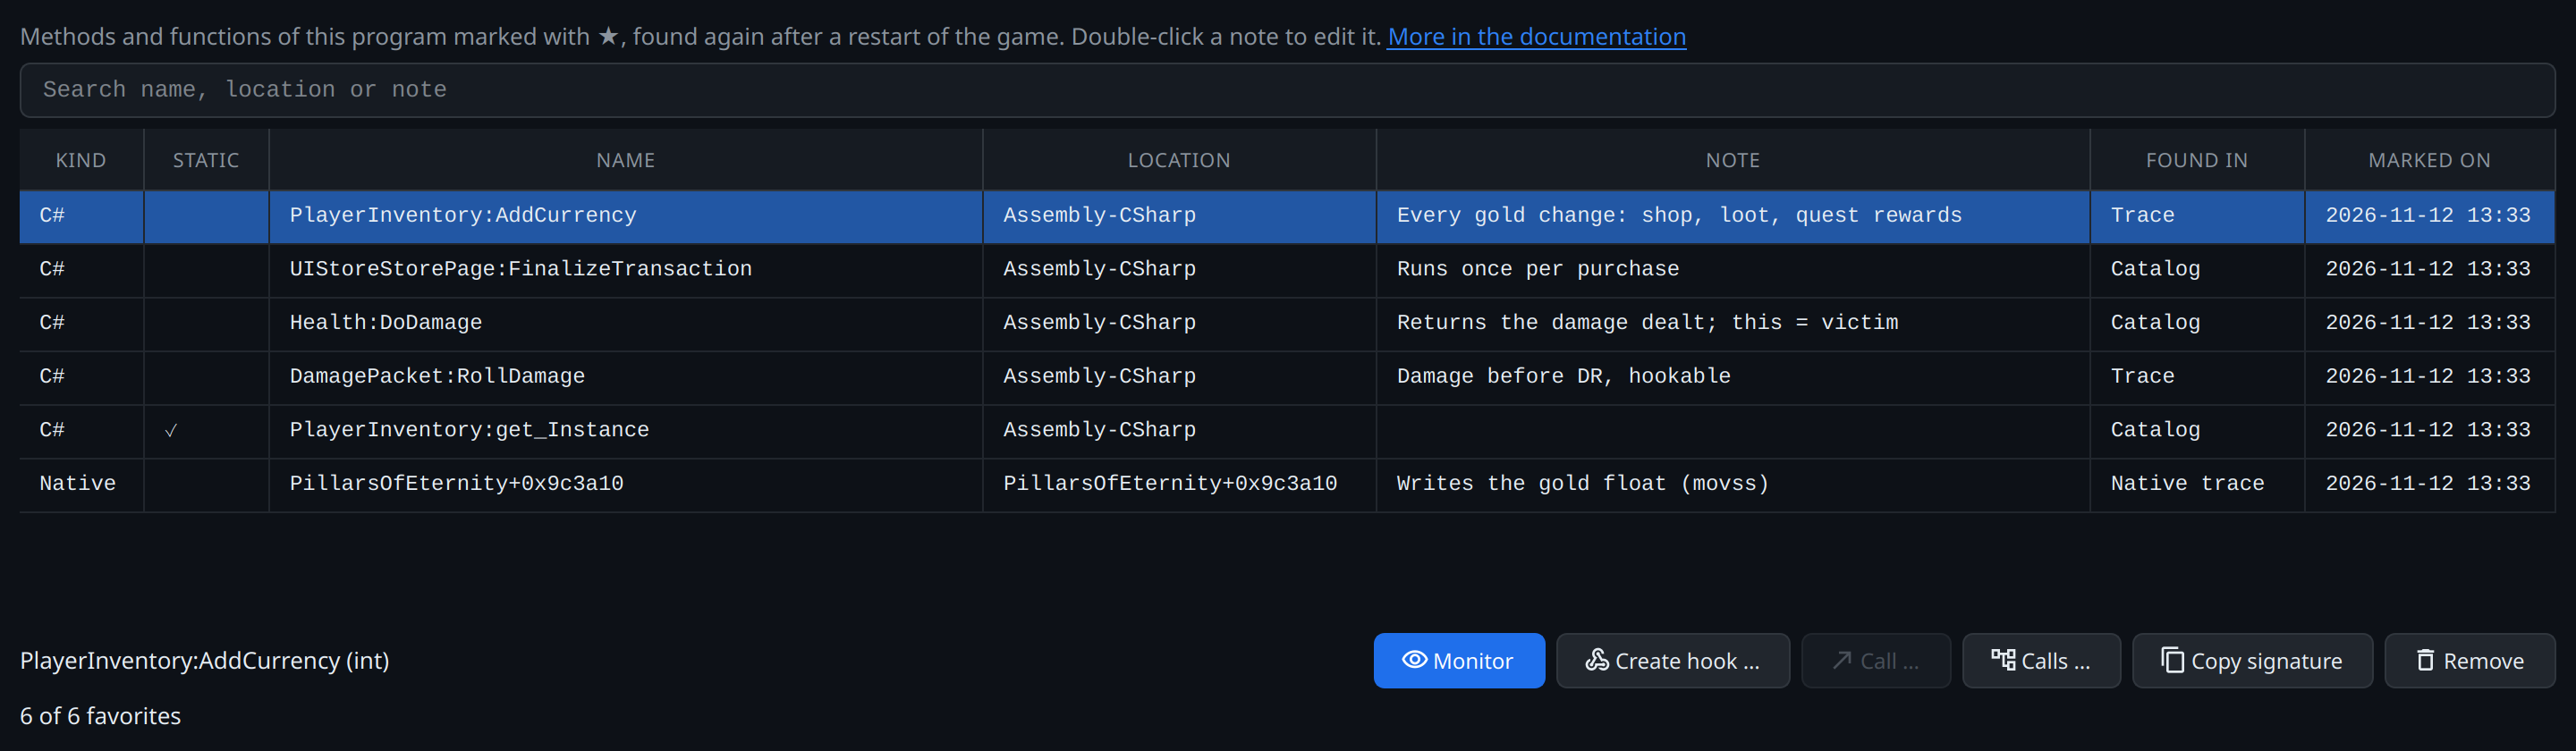
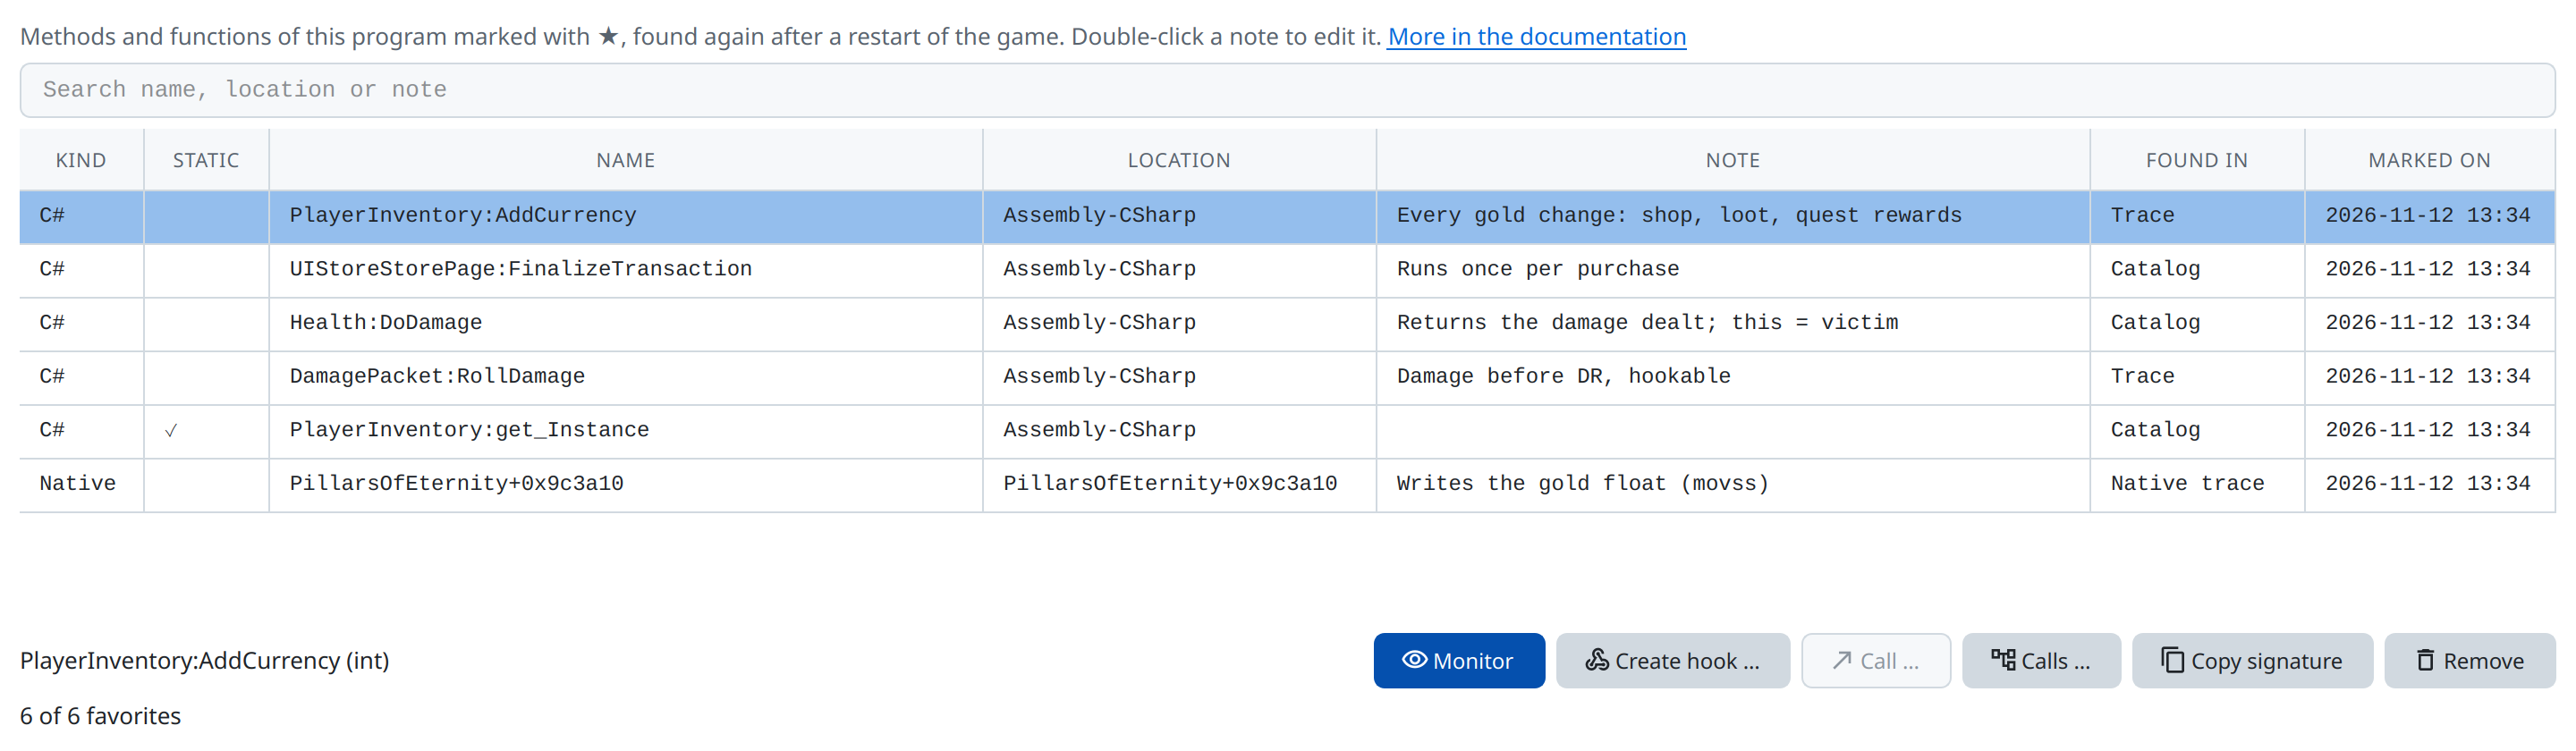
Methods and functions found in the catalog, a trace or the native trace can be marked with ★ in the first column. View → Favorites … lists them per program with a note, and hands them to the method or native function monitor. Favorites are saved at once, so they survive a frozen or crashed game.
Log and activity
Log in the status bar opens the log window. It turns red when errors were logged. The log can be docked at the bottom of the main window.
The Activity tab shows the activity log: the course of every run, written to activity.jsonl in the log folder. It records
- the attached process with its details: 32 or 64 bit, native or Wine/Proton with the Proton version, engine, how the gadget was loaded;
- sessions and agents in the order they started and ended;
- every call into the game with its duration and outcome (frequent ones summed up);
- clicks in Grembyte, and why a Frida session ended, with Frida's crash report.
Values from the game's memory are not in it. The activity log can be switched off in the settings.
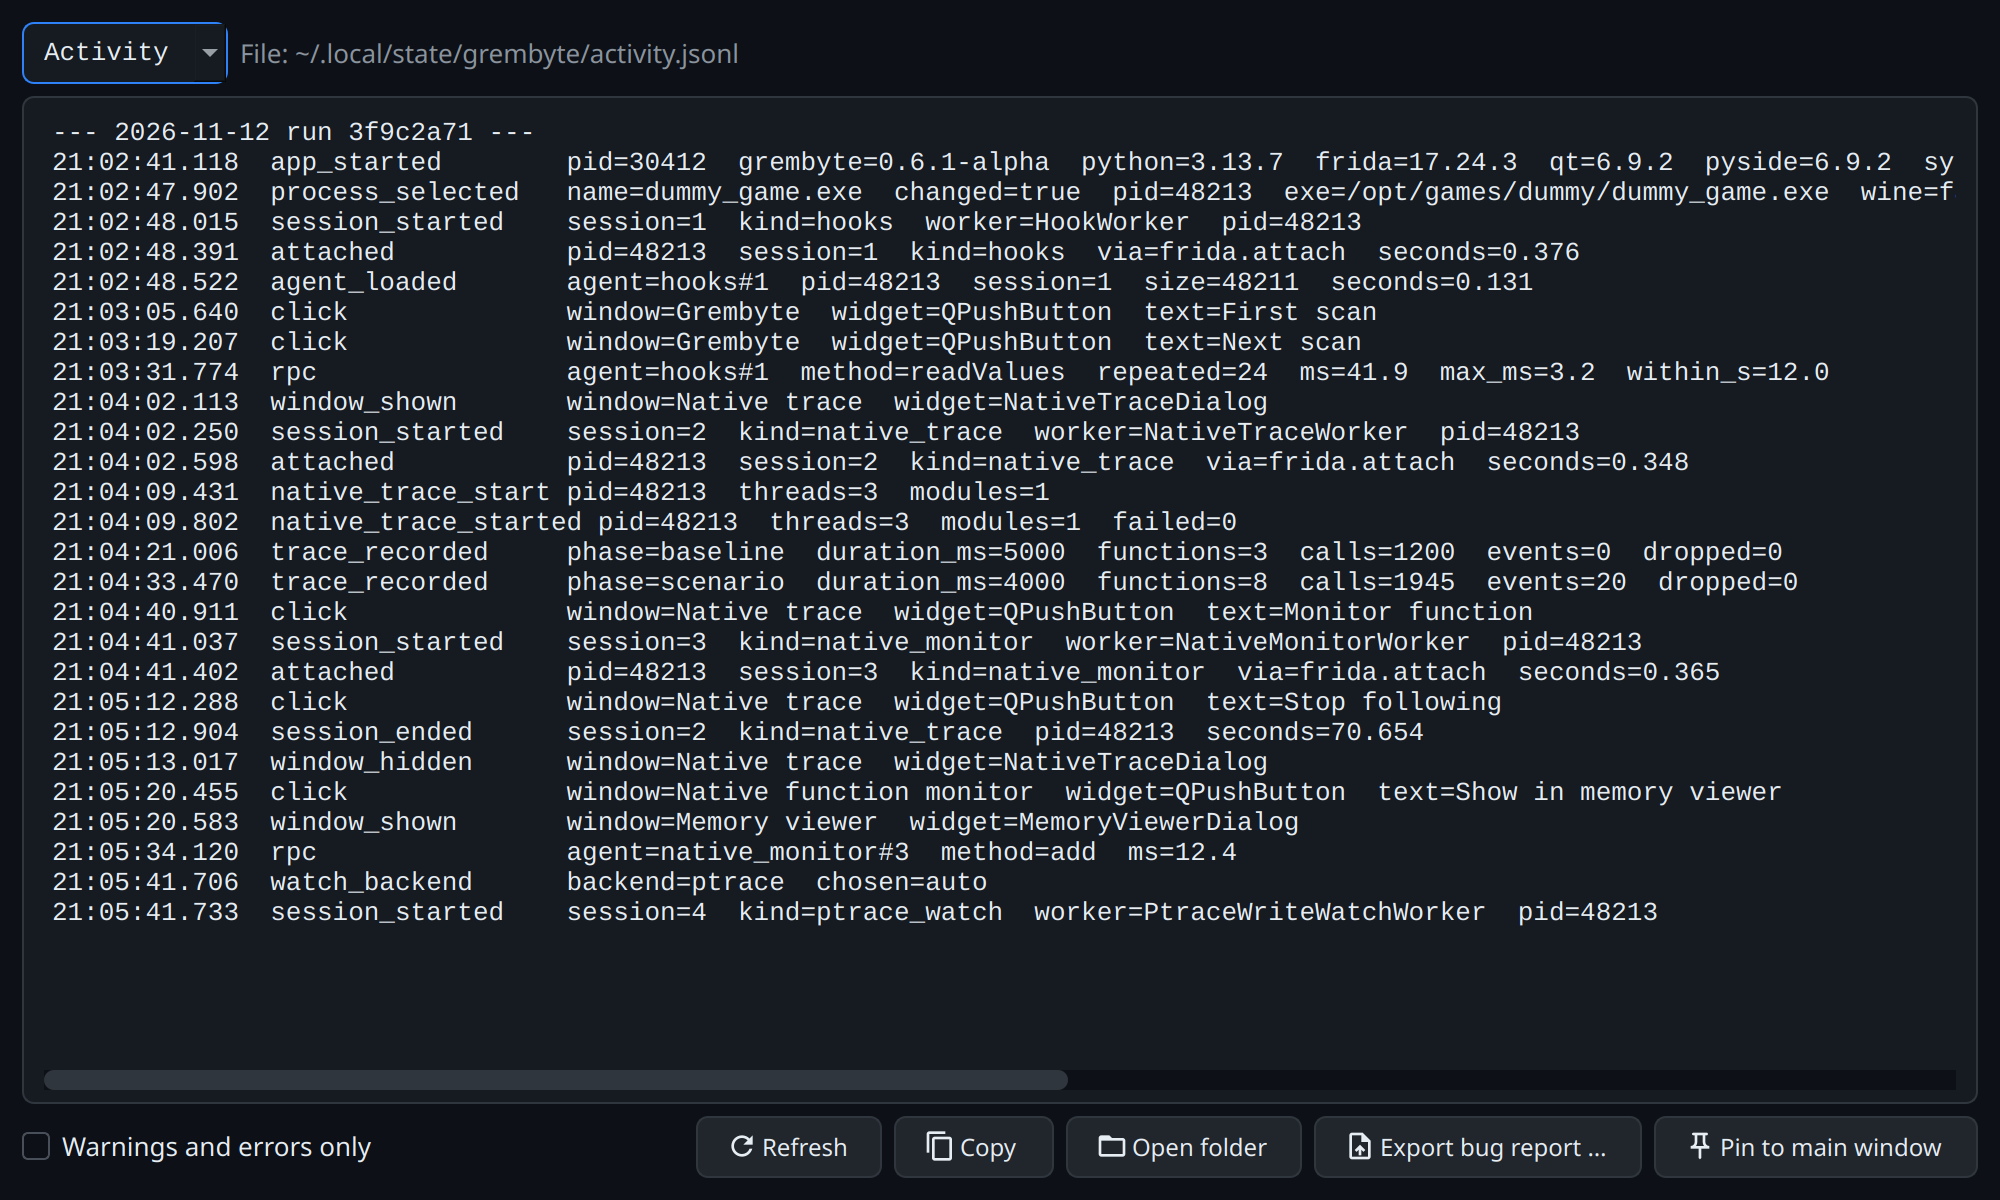
Export bug report … packs the activity, the log and crash.log into a ZIP file – the best thing to attach to a bug report.